Cascaded Lag: The Cumulative Impact of Latency on Applications and User Experience

Summary
Cloud solutions architect Ted Turner describes how Kentik Synthetics easily uncovers network-related latencies that often cascade into cloud application performance problems — DevOps teams take note.
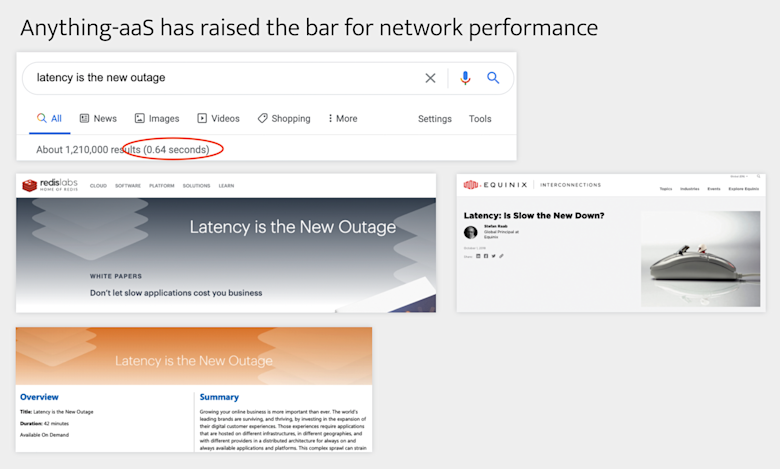
Latency is becoming more visible. My friend Anil just posted this graphic:

I shared a few words on this with my team, and they suggested this blog post. I’ve been addressing latency as part of my job description for as long as I can remember. When I onboarded here at Kentik, they said we had a cool new product coming out to help uncover network-related latency. I was ecstatic! Over the last 3 years of my last gig, I built a little bundle we could deploy with tools across public cloud instances or in our data center.
The idea of that little bundle was to figure out where latency was occurring. Was it network or application or OS related? Latency is what we were always trying to figure out.
Kentik announced its Synthetic Monitoring solution shortly after I arrived, and it’s been a hit across the Kentik user community. Necessity is the mother of invention, and I fell in love with the Kentik Synthetics right at first release. As the product evolved month over month, my love has grown stronger.
Kentik Synthetics was built from lots of feedback from our network-savvy community, and it has proven useful for these network-specialist teams. However, we are now finding that our integrations with APM suites also add value to the DevOps side of the world. These teams are really two sides of the same coin, with APM (and application observability) on heads and network observability on tails. (Over the years I’ve used the same analogy for network and security teams).
If the network is slow, the apps and user experience are going to be slow. But what if the network is not slow? What if it’s the database that’s slow? Transactions typically taking 20ms on a database can become slower. Let’s consider the database scenario for now, but this scenario can be applied at any tier component: application, service mesh, API gateway, authentication, Kubernetes, network backbone, WAN, LAN, switch, or firewall, etc.
When a single component becomes slower — i.e., it has a longer transaction time than calculated by the design or engineering team — the impact to all upstream components is usually plainly apparent. The key is to examine each component in the stack, and see which became slower first.
Going back to the database scenario, a 20ms transaction that slows to 40ms will usually not only cause a latency, but the rest of the stack will usually start to queue up additional transactions in parallel, a kind of cascading effect. Transactions queueing quickly become the failure point in the application stack, and it usually takes out multiple components along the way — firewalls, service mesh, API gateway, etc.
If the database were designed to handle 100 concurrent transactions at 20ms per transaction, then when the majority of the transactions lag to 40ms, we can predict that there will be 200 concurrent transactions per second, simply due to latency. These 200 concurrent transactions are where the cascading effect occurs and often blinds teams looking to make a change and fix something. Stated more simply, the latency cascade effect is concurrency. The concurrency cascade effect is overconsumption of downstream resources.
In my past work life, we would find latency at the transaction or packet level, and start to backchain through the systems, until we found no more latency. Sometimes the database was the cause all the way in the backend. Sometimes it was the application components in the stack. Sometimes it was the network components. No matter where the latency occurred, we would typically find a cascade of concurrent connections rising, with a correlating overconsumption of a finite resource. Cascading failures are definitely a thing.
At my last gig at a big enterprise, we tested our whole application stack every week. We had thousands of changes committed every week, and needed to re-calibrate the entire stack and understand latency, concurrency, and constraints on all of our finite resources. We set a two second response SLO for a web page load (for the entire page) for 90% of the transactions. This means all operations — across the front-end web tier, all networks, application stack, authentication, authorization, and database transactions — all had to be < 2 seconds, or the time budget would be blown. Generally we had a second rule, where all transactions needed to be completed < 4 seconds (100%). If these general guidelines were broken, all teams had to go back and start re-understanding their latencies, concurrencies, and constraints.
Here at Kentik, we started our comprehensive understanding of networks via NetFlow, *flow, consumption. Over the years, we have added SNMP, streaming telemetry, and now synthetic testing. Together, this is what we call network observability: the ability to get fast answers to any question about your network, across all networks and all telemetry.
A testament to the need to tackle cascading latency across the stack is that we’re now partnered with New Relic to make it easier to correlate both the application telemetry with network telemetry. With New Relic and other APM vendors, Kentik can team together and start to figure out where the latency originated first, and quickly identify what really needs to be fixed in the stack, from everything that can break in a cascading outage.
Final Thoughts
For network teams, the Kentik #NetworkObservability platform reduces mean time to innocence. Many times in a cascading failure, the network is not to blame. However, when the network is the issue, we’re usually able to pull telemetry from all network components and help point to the network component at fault. This is a win not only for network teams, but also application and DevOps teams.
If you’re not using Kentik yet, I urge you to sign up for a free trial. We can help with easy-to-start synthetic monitoring, without touching your network or application stack. And if you like what you see, we can help with extending to your physical networking, virtual networking, and cloud networking. When you want to correlate issues with APM suites, we do that too.
Take us for a spin!


