Disney+ Launch: What Broadband Providers Need to See

Summary
Disney+ launched with an impressive debut, especially considering that technical problems, potentially capacity issues, plagued the service shortly after launch. In this post, we look at Disney+ traffic peaks around launch. We also explain why, during high-profile launches like that of Disney+, broadband subscribers are likely to blame their provider for any perceived problems. Network operators must be able to understand the dynamics of new loads placed on the network by new services and plan accordingly.
Disney’s Disney+ service launched on Nov. 12 to much fanfare. In case you’ve been hiding under a rock, Disney+ is a subscription-based, video-streaming service operated by none other than Disney. In the past, Disney has licensed their extensive content library to other streaming providers (including Netflix), but they’ve now pulled all that content back in-house to deliver it via their own service. With a massive catalog that includes popular content from Disney and Disney-owned Pixar, Marvel, Lucasfilm (Star Wars) and National Geographic, all eyes have been on the company to see how popular its new service will become.
Here at Kentik, we thought it would be interesting to dive into the details of the launch from the network traffic perspective. For that purpose, we reached out to a few friendly Kentik customers who were willing to share their data for the analysis. Kentik’s platform includes our True Origin technology, which identifies the OTT service associated with network traffic and also the CDN provider that delivered it. This allows network service providers to understand how subscribers and OTT services are utilizing their network. They can then make more informed network planning decisions to ensure that there is enough capacity to deliver the OTT services subscribers are using and to optimize their performance.
First, we wanted to know how much traffic Disney+ was actually delivering to get a sense of just how popular it might become, especially compared to other streaming services.
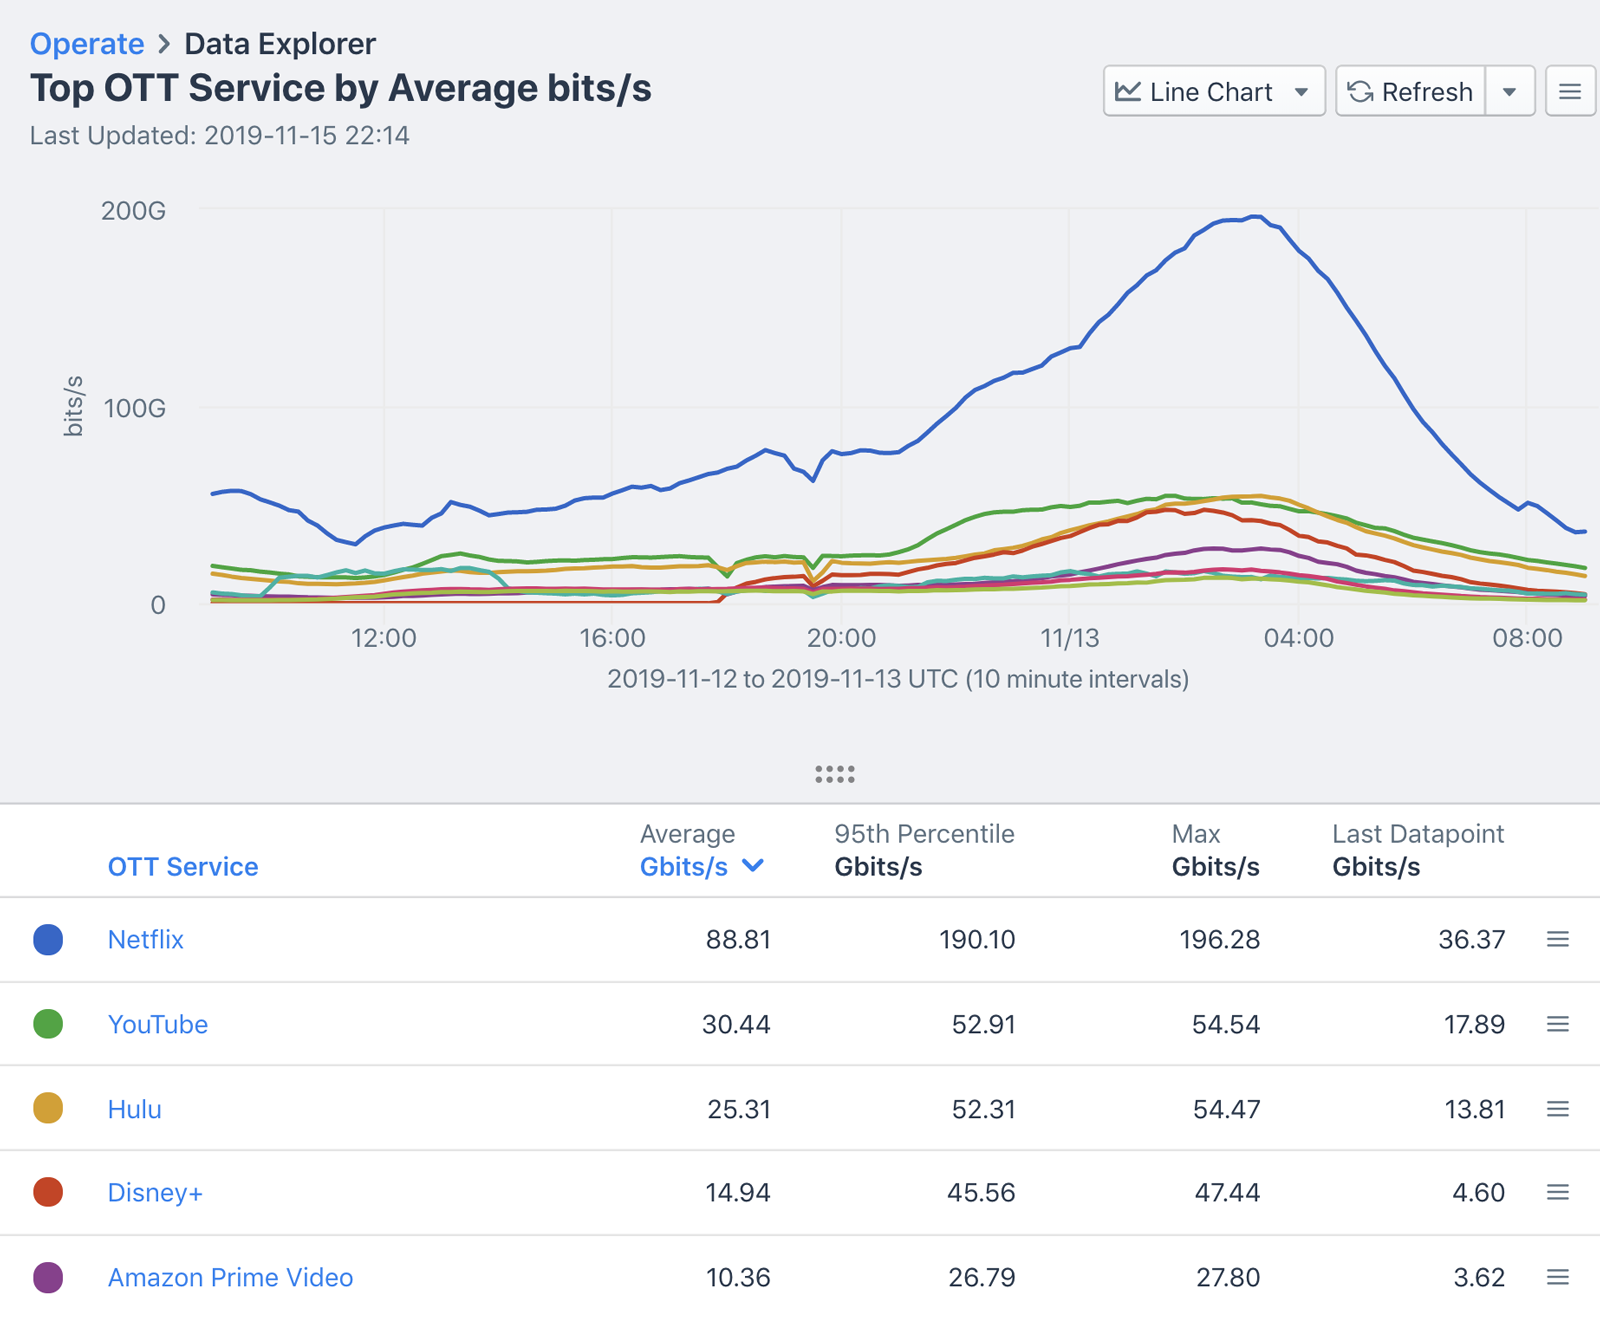
In the graph above, you can see the start of traffic from Disney+ around 18:00 UTC on launch day. It then quickly rose into the top 4 streaming services, nearly equaling Hulu by 23:00. By Thursday evening (Nov. 14), Disney+ traffic had grown to 55 Gbps at peak on this network, and briefly surpassed every streaming service except Netflix.
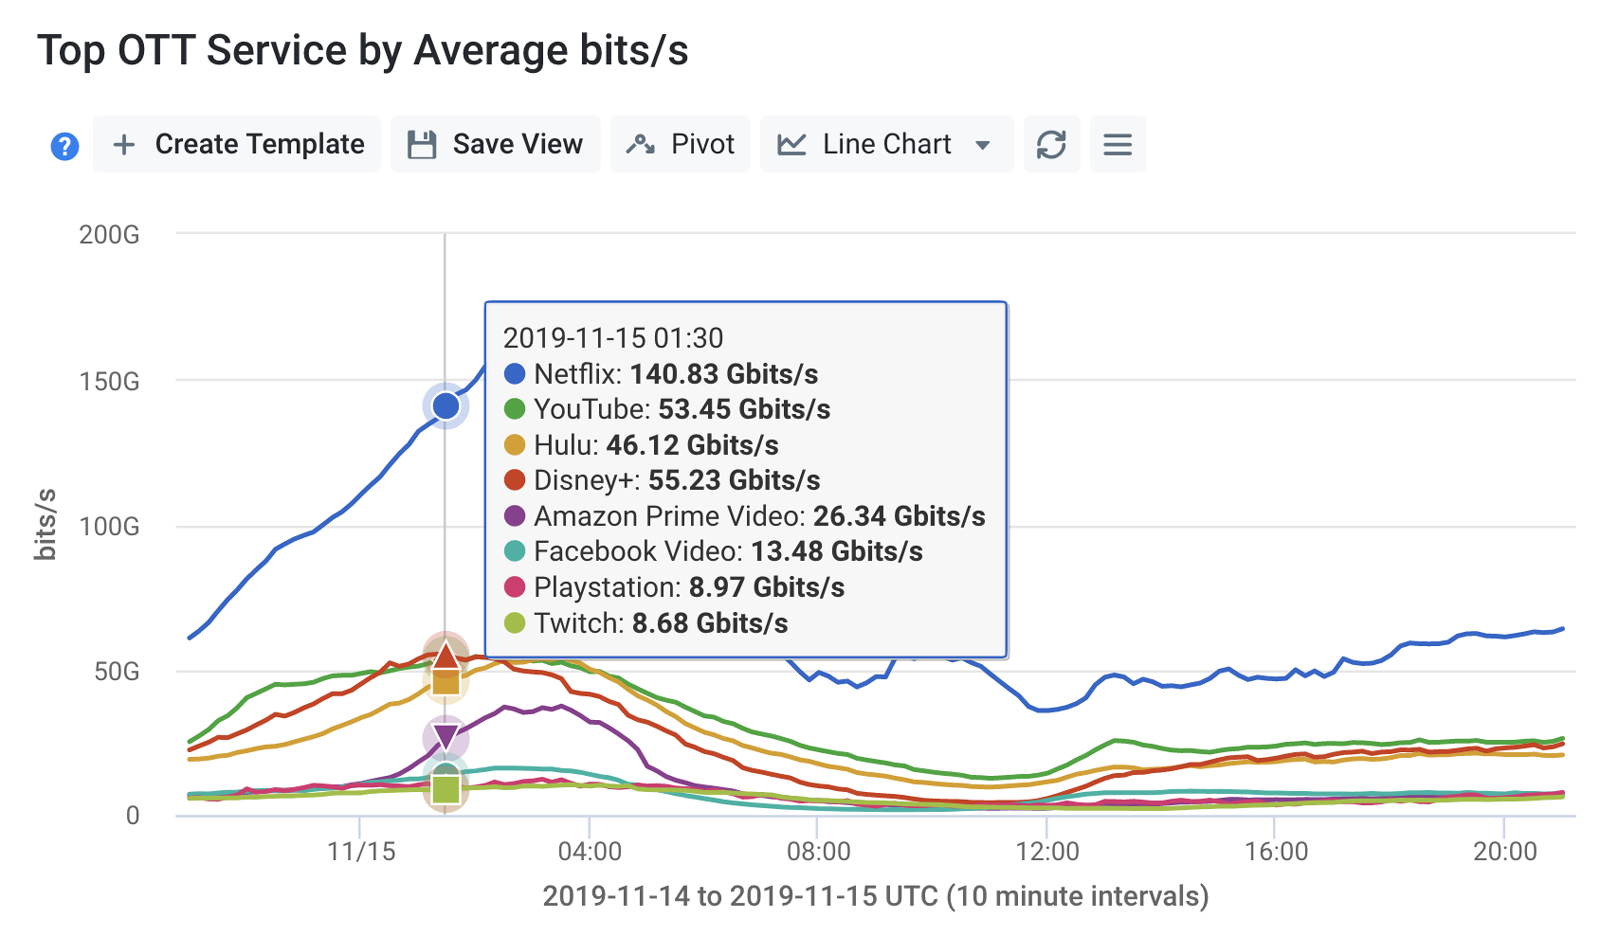
That’s an impressive debut, especially considering that technical problems (potentially capacity issues) were plaguing Disney+ shortly after launch. It’s also interesting to see that Disney+ traffic peaks about an hour before other streaming services — around bedtime for younger viewers.
We also thought it would be informative to look at how Disney+ was distributing video content to subscribers. It’s been widely reported that back in 2017, Disney bought BAMTech, a long-time player in streaming video delivery. BAMTech provides the technical prowess, but where exactly do the bits originate?
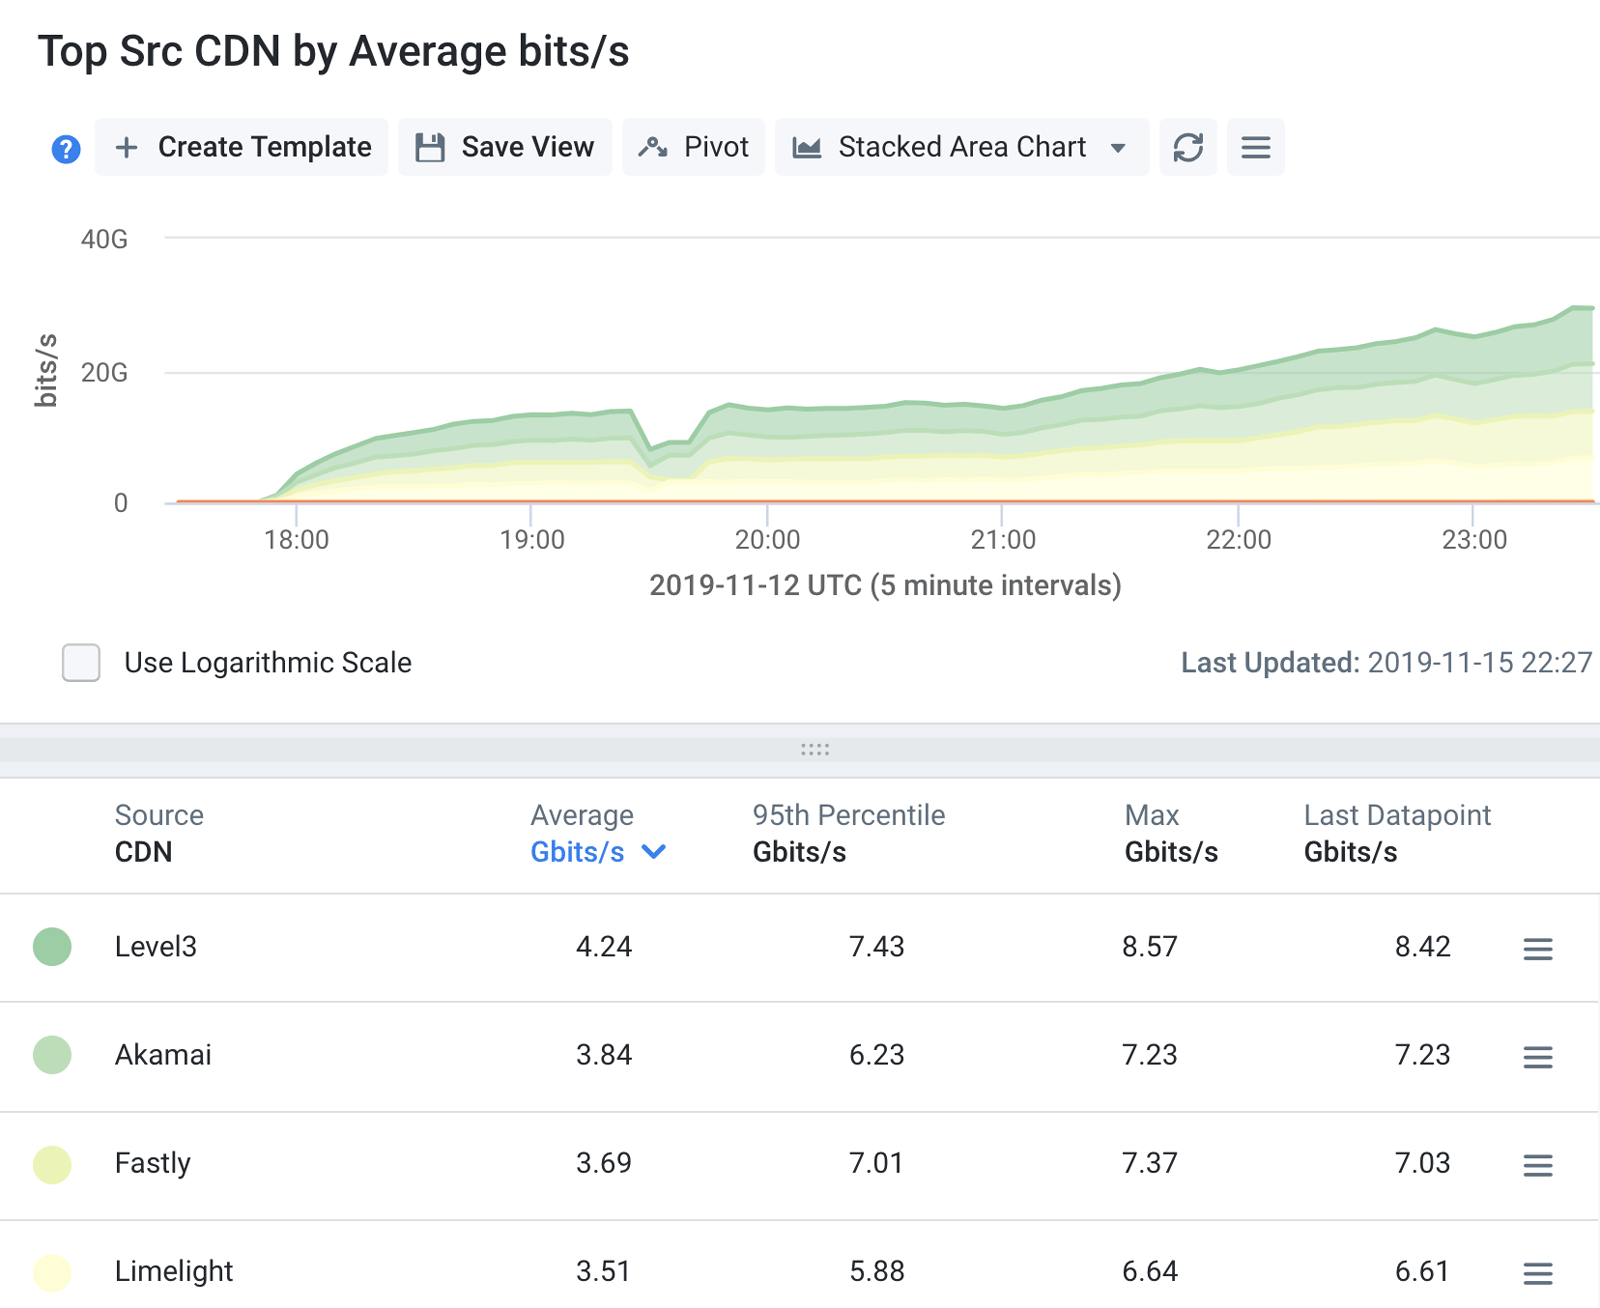
From the perspective of one Kentik customer’s network, we can see that Disney+ utilizes a slew of different CDN providers to deliver traffic to viewers. Traffic volume is roughly evenly split among Level 3, Akamai, Fastly and Limelight — and the split seems to stay fairly consistent as launch day progressed.
Looking from the perspective of a different customer’s network, the distribution of traffic among CDN providers is much different. Here we see Verizon Media (formerly EdgeCast) in the mix. Level 3 is delivering the largest share of traffic, with a smaller uneven split among the other providers. CDNs already use various metrics to serve content from the node that will provide the best performance for each user. But it appears here that Disney+ is also intelligently choosing the mix of CDN providers that will deliver the best performance based on the geolocation (or other metrics) of the destination viewer’s broadband provider.
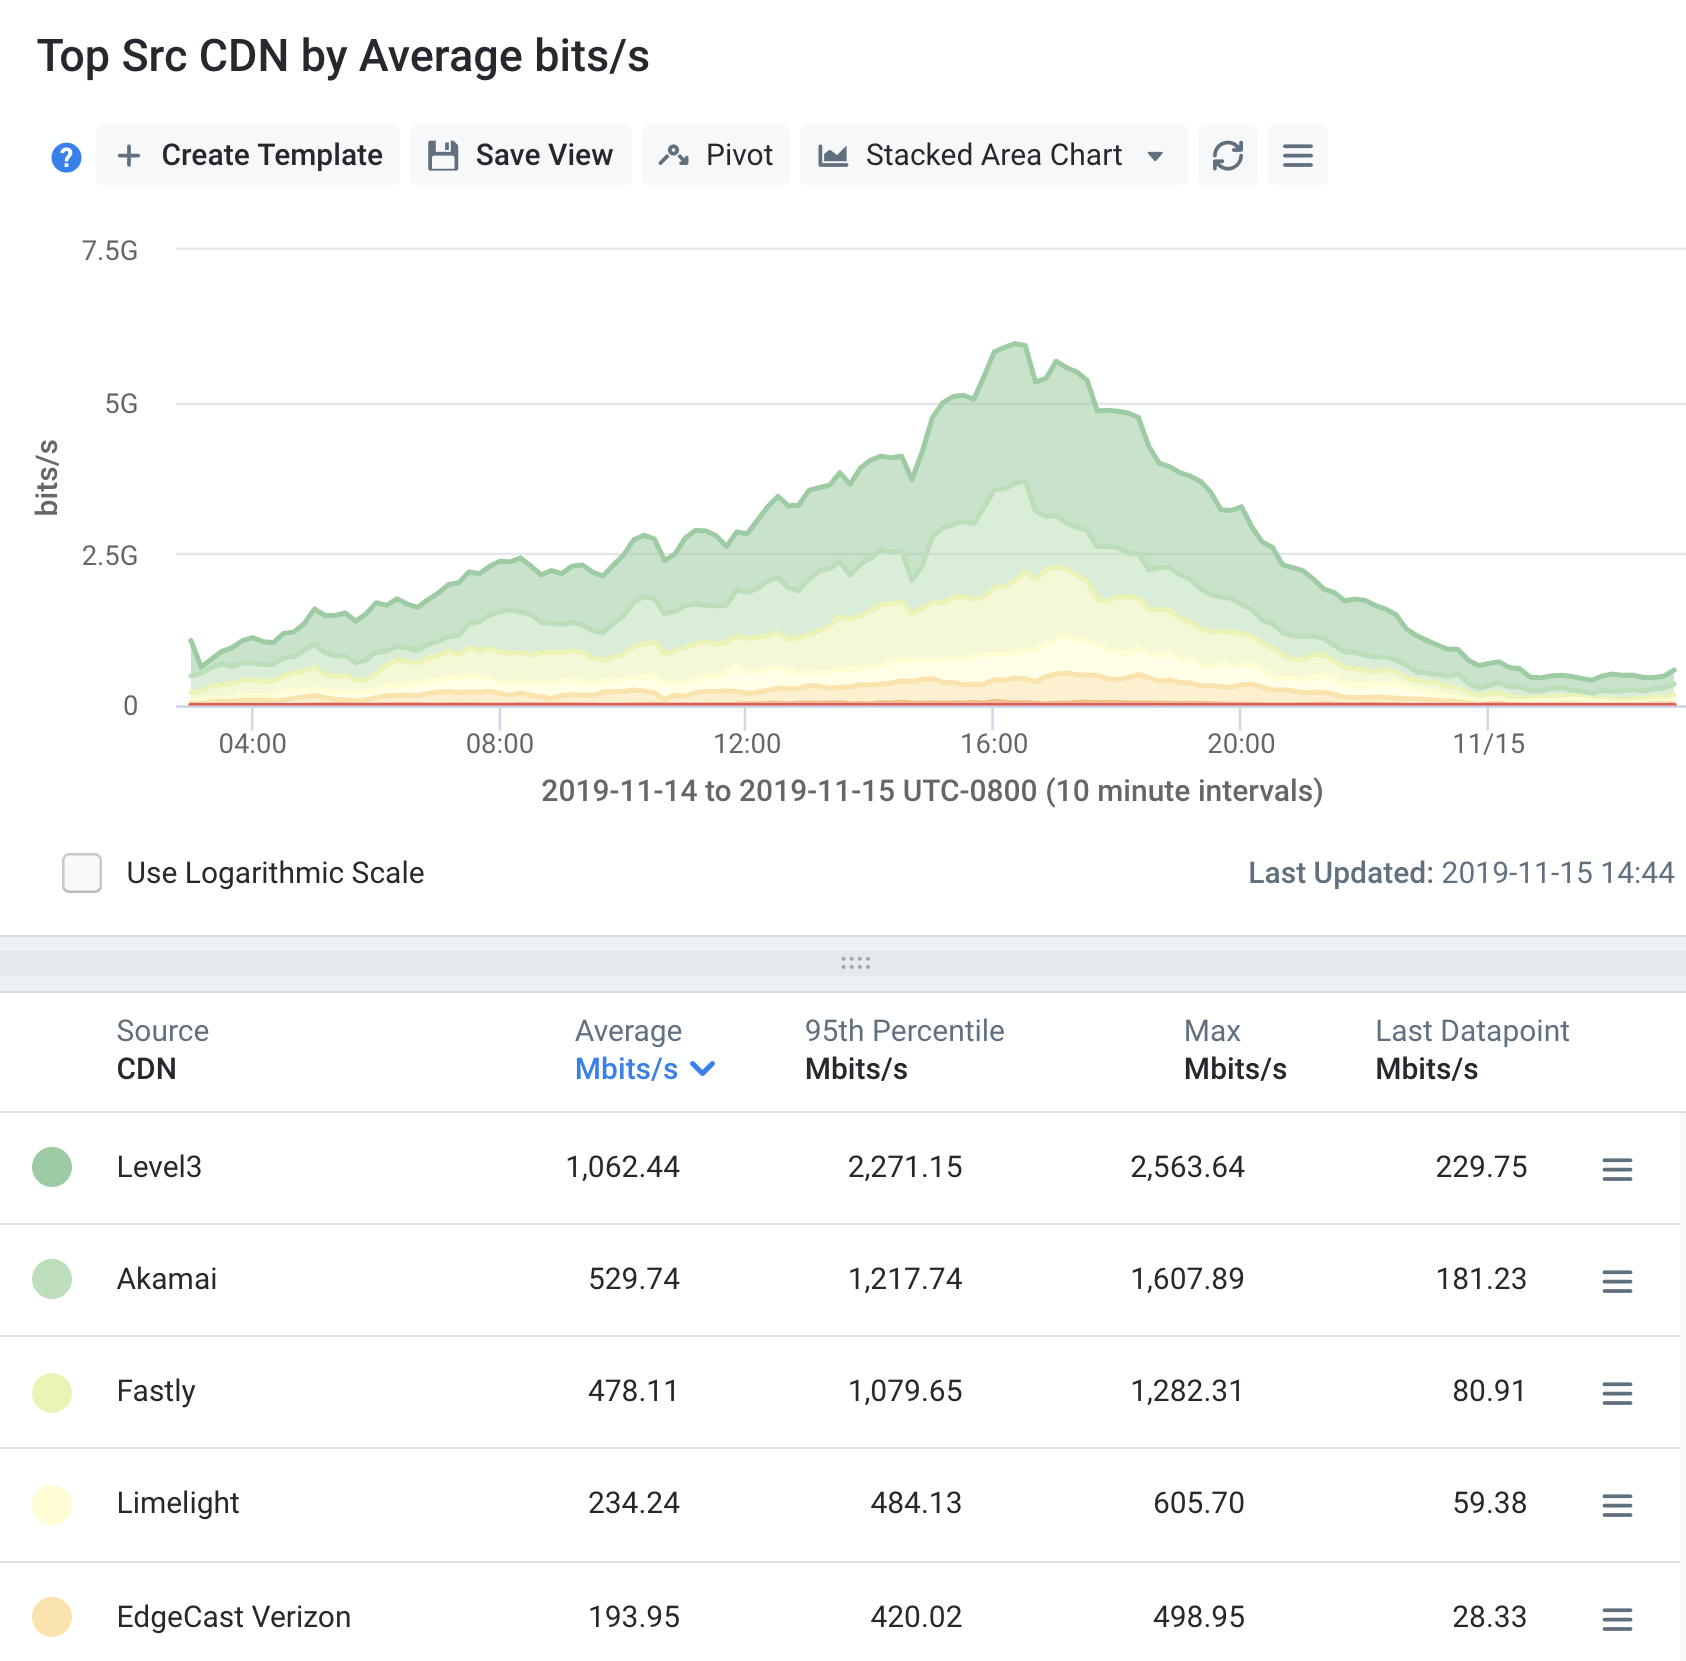
In another customer’s network, we observed a bit of an anomaly shortly after the Disney+ launch. Verizon / EdgeCast (light green on the graph) suddenly dropped out of the mix of CDN providers — and overall traffic volume dropped as well. We know that Disney+ was experiencing some technical problems at launch, and perhaps this shift is evidence of corrective action.

Another window into traffic delivery is the average per-viewer bitrate, segmented by CDN provider. This is derived by dividing the total traffic volume for a CDN by the number of active Disney+ viewer IP addresses for each CDN. Fastly, Level 3 and Limelight are all neck-and-neck in terms of performance, with Akamai somewhat below those three, and Verizon / EdgeCast well below the rest.
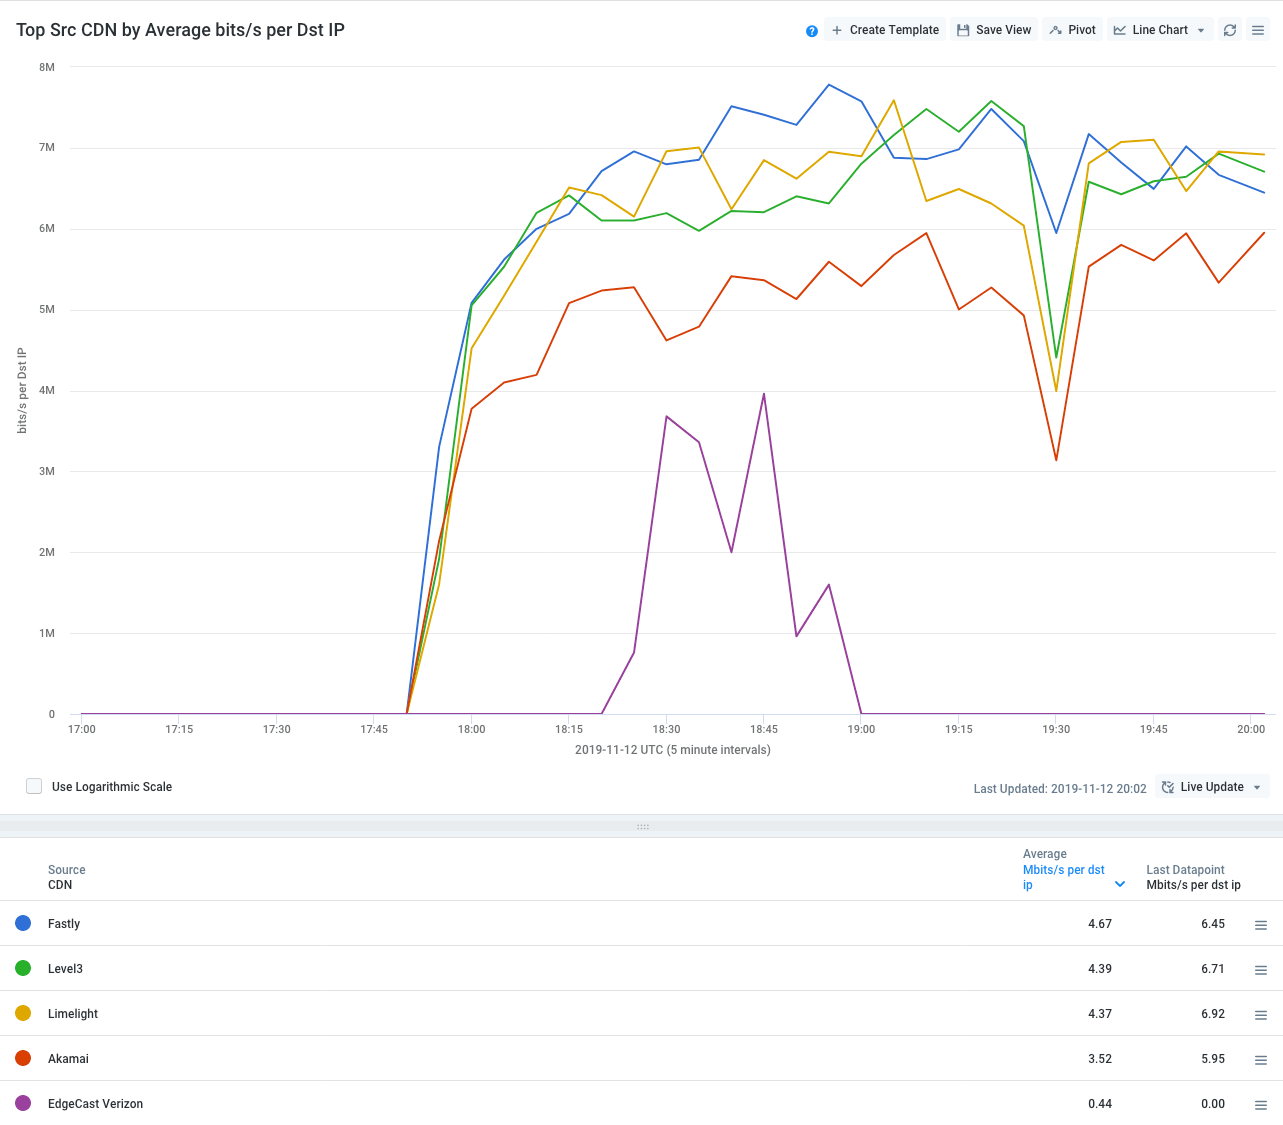
Note: The low values for Verizon’s EdgeCast are likely due to their very low number of samples, as this CDN is barely being used to deliver Disney+ for this ISP.
While these graphs and data are interesting to look at to gauge the launch of Disney+, they’re also critical insight for the broadband providers that deliver this traffic to end-subscribers. During high-profile launches like this, broadband subscribers are likely to blame their provider for any perceived problems. Network operators must be able to understand the dynamics of new loads placed on the network by new services and plan accordingly. That includes active management and planning to make sure adequate capacity is in place to the CDN traffic origins, or local caches to bring the traffic origins on-net.
If you’d like to see how Kentik can help you understand the dynamics of subscribers and OTT services on your own network, request a demo or sign up for a trial.
