Kentik Hackathon!

Summary
The range, creativity, and skills of the Kentik engineering team were on full display at our recent on-site for local and remote engineers. Gathering to confer on coming product enhancements, the team also enjoyed San Francisco dining and tried recreational welding and blacksmithing. But the highlight was our first-ever hackathon, which yielded an array of smart ideas for extending the capabilities of the Kentik platform.
Versatile Platform Inspires New Angles on Network Visibility

What does a top-notch engineering team do for fun? At a recent on-site in our San Francisco headquarters, Kentik engineers both local and remote came together to confer on work in progress, discuss technical topics, and plan for the year ahead. But it wasn’t all business; there were also nights out at San Francisco’s famed eateries and team activities including recreational welding and blacksmithing (you never know when you’ll need to shoe a horse). Perhaps the most interesting of these events was a hackathon that kicked off after work one evening and concluded with participants presenting their efforts the following afternoon. Some were mostly for fun and others were more practical, but all of our hackathon projects illustrated in one way or another the range, creativity, and skills of our engineering team. Let’s take a look at a few examples…
CDN Traffic Density-O-Meter

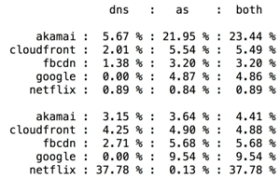
Large service providers are particularly interested in knowing how much of their transit traffic is actually CDN traffic. The problem is that since CDN servers are hosted in many ISP domains, under the ASNs of those ISPs, it’s not possible to identify CDN traffic strictly from source ASN. This project took a feed of DNS data and performed a streaming analysis of flow data. Using source AS or DNS matching it was possible to detect the percent of traffic in a given network that was from CDNs as well as the cumulative (overlapping) percentage.
Geo-Mapping Projects
We had two engineers who created nice visualizations utilizing data from our API. This first one is a 2D geo-visualizer based on snapshots fed into the webgl library wrapped in React.

A second geo-mapping project, this one in 3D, utilized the three.js library at 60 frames-per-second rotation.

“Kentik, How Much Traffic Am I Sending to…?”
This one is pretty hard to illustrate without a sound recording (oops!), but the idea was to integrate Amazon’s Alexa voice control with the Kentik portal UI, allowing the operator to pose simple, voice-based queries to Kentik Detect. The project primarily scoped around answering the simple question “How much traffic am I sending to [destination AS name].” It actually worked, and it was pretty entertaining.
Sensor Data to KDE
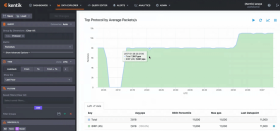
Another fun project utilized kFlow (Kentik’s internal flow-data protocol) to send measurements from an Intel Arduino board and GPIO-connected temperature sensor to the Kentik Data Engine (KDE), our distributed big data backend. The data was used to trigger alarms that were defined in alert policies in our alerting system. There wasn’t time in the hackathon to modify the UI, so as shown in the following graph humidity was mapped to the protocol field while the temperature (divided by 100) was mapped to the Packets Per Second (PPS) metric.

Getting the Most out of Docker for Mac
One of our intrepid backend devs focused on a practical use of the Docker native application for Mac. The challenge is to not have any local variables affect anything when invoking the build scripts from the github repository. The answer is to ensure that everything happens in a docker container from images that are pre-built. This way, when you control the whole stack, you can run Docker on any distro and it will work the same no matter what. The project demonstrated running a seamless build process on Docker for Mac.
A Probe Prototype

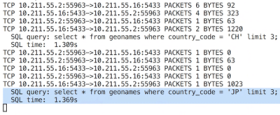
In this project, the engineer created prototype code in Rust of a packet capture probe that reads directly from the Berkeley Packet Filter (BPF) on Linux and performs protocol decodes, such as the SQL query statement and time at right.
Lighting Up Alerts
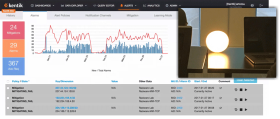
Another project involved triggering different-colored LED lighting modes from alarms that were defined in alert policies in our alerting system. Simple… and fun stuff!

Route Traffic Density Calculator

For Web enterprises operating large-scale Internet edges, the cost of a single, name-brand edge router can be $1M or more. It takes a lot of $24.99/month subscribers to make that pay. So a major area of interest is exploring the use of lower-cost edge routers or even white box-based solutions. The challenge is that lower-cost routers have dramatically less FIB capacity than the big brand boxes. So the key question is whether you can handle traffic for the vast majority of your customers with a much more limited FIB. If you can manage sending most of your (important) traffic within that envelope, you can use a default route to handle what’s left over.
In this project, traffic was grouped by tranches of routes and analyzed to determine what percentage is being handled by how many prefixes, giving practical insight into which prefixes to include in the FIBs of lower-cost routers. This project can be a starting point for network teams to explore how to maintain service quality and user experience for apps via their Internet edge while reducing CapEx.
Come join us!
Given the fairly short time frame, our first hackathon generated a lot of fun and valuable projects. Some projects can be put into action internally, and some can even be used to a limited degree in their raw form to help customers figure out answers to business-relevant questions. So it was a worthy capper to our engineering conference. We’re looking forward to more hackathons in the year ahead as both the product and the engineering team grow rapidly. What about you? Would you like to help build the industry’s most powerful network analytics engine? We’re hiring!
