NMS Migration Made Easy: Gathering Information

IntroductionStep 1: Gather an inventoryBefore we start, what does “gather” mean?Device listPer device resources and detailsPer device custom elementsAPI poller itemsCustom SNMP objects (OIDs)Beyond the deviceCustom propertiesGroupsDiscovery settingsUsersPolling enginesSMTP serversTicket system settingsDashboardsReportsAlertsA quick word about query-based elementsStepping back and looking ahead
Summary
Network monitoring tools have a lot of moving parts. Those parts end up getting stored in a wide range of locations, formats, and even the ways various capabilities are conceptualized. With that in mind, we’re going to list out the information you should gather, the format(s) you should try to get it into, and why.
Here at Kentik, we are (justifiably) excited about Kentik NMS. It’s a monitoring solution that is right-sized for the job and built on a modern foundation — from concept to code — so that it can support your most valuable equipment. With the ability to collect data from traditional technology like SNMP and the latest techniques like streaming telemetry, Kentik NMS is positioned as the right solution for today’s network observability requirements.
But NMS migration – making the move from whatever you have today – is a lot of work. We realize how big a job migrating systems can be, so we wrote an NMS migration guide to help make that process easier.
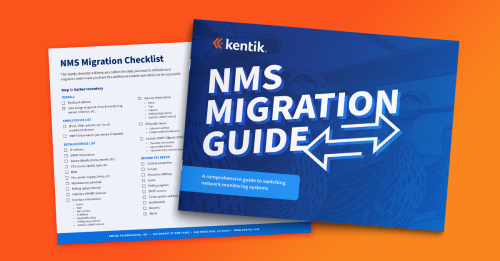
However, we recognize how precious your time is. Not everyone has time to read a comprehensive 33-page guide, so we thought we’d take some of its insights and knowledge and break it up into bite-size installments.
Welcome to part 1: Gathering Information.
Introduction
Kentik NMS is a re-envisioning of traditional network monitoring tools, with all the familiar interfaces and options, but with a clear eye to both the current and future state of infrastructure, whether that’s on prem, in the cloud, in multiple clouds, or all of the above.
This means Kentik NMS presents the opportunity to pivot away from older monitoring solutions – those with tired and ineffective interfaces, slow and inefficient architecture, limited scope, and decades-old code bases with all the technical debt that comes with them.
You’re probably thinking, “Easier said than done!” Right? So are we. Kentik is a company built by engineers for engineers. We understand that a new solution simply existing doesn’t in and of itself solve the challenge of moving to the new system.
Kentik has been in the monitoring and observability game for a long time – not just as a business but as individuals who work here. Many of us have decades of experience with systems migrations between databases, operating systems, development frameworks, data centers, monitoring solutions, and myriad technologies spanning decades of Moore’s Law iterations.
That brings us to this post. The goal is to help you understand what steps are involved in a monitoring system migration – to help you validate your checklist and ensure no critical steps go unnoticed.
It’s important to note that while this post specifically references SolarWinds, much of the information you’ll find here is relevant to just about every monitoring tool on the market. To be sure, the solution you’re using today will likely have peculiarities we won’t explicitly address (let’s face it – those “peculiarities” may be the reason you need to migrate in the first place!).
We realize how big a job migrating systems can be. We’ve broken this post into steps to help you manage the work (not to mention the potential stress and anxiety) that large tasks like this tend to create. They are:
- Step 1: Gather inventory
- Step 2: Get stakeholders aligned
- Step 3: Launch the alternative (Kentik)
- Step 4: Wind down infrastructure
Without a doubt, step one is the most extensive section and represents the most significant investment of time and effort. However, step 2 holds the most challenges for IT practitioners, who may not relish the political aspects of the job. Step 3 is the “moment of truth” section, where iteration, course correction, and education occur. Many people find step 4 the scariest one, as it holds such finality. Nevertheless, it’s an important step too.
Whether you’re just at the point of considering NMS, currently kicking the tires, or have even taken the plunge as a paying customer on the cusp of flipping the switch, we invite you to pour another cup of your favorite beverage, settle into a comfortable chair, throw on a set of headphones, queue up your “music to kick ass to” playlist and read on.

Step 1: Gather an inventory
”Mise en place” is important for more than just chefs in the kitchen. Any effective strategy begins with knowing what you have and where it is.
Network monitoring tools (and SolarWinds is by no means unique in this regard) have many moving parts. Those parts end up being stored in a wide range of locations, formats, and even the ways various capabilities are conceptualized (is a report a unique thing, or is it just a different style of dashboard?).
With that in mind, we will list the information you should gather, the format(s) you should try to get it into, and why. This list will be organized primarily with an emphasis on the things you’ll need for migrating to Kentik NMS but with a secondary focus on ensuring you have all your data available in case you need to go back and refer to it down the road when your current solution (and the systems it was running on) have been put to bed.
Before we start, what does “gather” mean?
Some people will begin scanning this list and become discouraged because of its volume of work.
I want to be clear that “gather” doesn’t mean you need to manually copy that information, print out reams of reports, or replicate the data into CSVs. You simply have to ensure that you have the data and can access it once the monitoring software has been turned off.
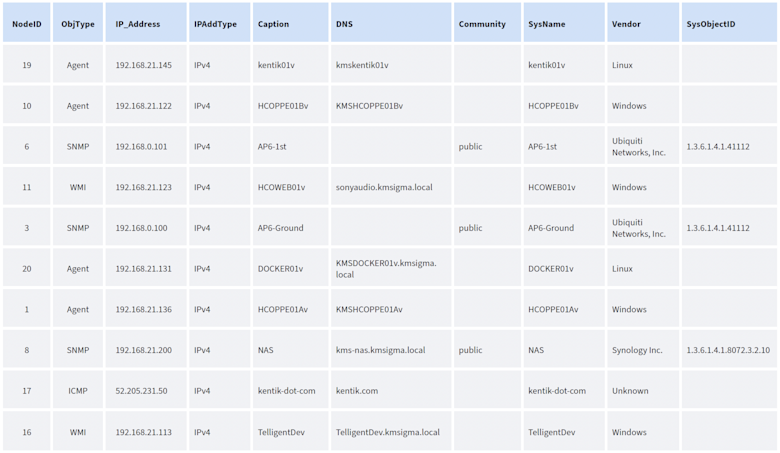
In the case of SolarWinds (presuming you have some basic SQL skills), that’s as simple as making a snapshot of the database. Everything you need is in that database and can be obtained with a query (or three). To be sure, sometimes running a report or using the SolarWinds SDK to extract the information while everything is still running is more manageable. But at the end of the day, the database is enough because Kentik has more than a few folks on staff who can give you a hand.
Device list
It doesn’t exactly require a blinding flash of insight to recognize that the most important thing you’ll need for a migration is a list of devices (or “nodes,” as SolarWinds prefers to call them). In this particular situation, it’s doubly important: first, because that’s the essence of what you’ll be monitoring in Kentik NMS. Second, nodes are the center of the SolarWinds architecture, the point from which all other references flow. For these reasons, it’s crucial to spend more time collecting and validating this list than any other task.
What you’ll need for Kentik NMS:
Note that Kentik NMS requires very little information in terms of migration. We need only a set of IP addresses plus the SNMP credentials they use, and we’ll pick up everything else on the machine.
However, as we said before, collecting more information now allows you to validate your migration and ensure you have the additional context and details for the times when NMS inevitably grows and expands.
The smallest amount of information Kentik NMS requires is:
- A list of IP addresses for the devices you want to monitor
- One or more CIDR notated subnets where all the devices to be monitored reside (example: 192.168.1.0/24)
- SNMP information: Depending on the version the devices are running, that would either be:
- SNMP version 2c
- The read-only community string
- SNMP version 3
- The username
- Authentication type and passphrase
- Privacy type and passphrase
- SNMP version 2c
If you’re a minimalist, that’s all you will need!
Per device resources and details
The (sad) truth is that many of us are not minimalists. Most of us have experienced the pain of deleting “unnecessary” information only to discover hours or even minutes later that we absolutely needed that data and could not get it back.
For everyone else in this camp, here’s a reasonably comprehensive list of data elements you’ll want to ensure you have for each device/node in your current monitoring solution.
Specific to SolarWinds, these are the essential items displayed on the Node Details page, which can be gathered via a series of reports, SDK commands, or (as mentioned earlier) database queries.
- IP address
- SNMP information
- SNMP version 2c:
- The read-only community string
- SNMP version 3:
- The username
- Authentication type and passphrase
- Privacy type and passphrase
- SNMP version 2c:
- Device details (name, model, etc.)
- CPU count, speed, type, etc.
- RAM
- Hardware
- Fan, power supply, temp, etc.
- Maintenance schedule
- Polling (ping) interval
- Statistics (SNMP) interval
- Interfaces: For each NIC on the device, ensure you have its:
- Name
- Type
- MAC address
- IP address
- Bandwidth rating
- Polling (ping) interval
- Statistics (SNMP) interval
- Volumes: For each drive on the device, ensure you have its:
- Name
- Type
- Capacity
- Polling (ping) interval
- Statistics (SNMP) interval
Per device custom elements
Along with the device details and the elements that are tightly bound to that device (CPU, RAM, disks, interfaces, etc.), there are additional items you’ll want to make a note of because they reflect the data you’re currently collecting.
That list includes:
API poller items
While Kentik NMS doesn’t – at the time I’m writing this – support the collection of API-based telemetry, it is on the roadmap. Therefore, it’s worthwhile to save the critical information you’ll need to migrate these data collections when the time comes.
You’ll need to note:
- The collection method (GET, POST) and the URL
- The headers and body elements
Note that a single API poller in SolarWinds could comprise multiple GET or POST requests and be very complex. Make sure you’ve got the entire sequence!
Custom SNMP objects (OIDs)
Every monitoring solution chooses which SNMP objects (OIDs) are collected as a standard for each device type. However, additional items are always useful and even necessary in specific situations. Many monitoring tools allow you to specify those OIDs and assign them to various device types, providing additional insight into the status and operation. Examples include temperature sensors, power readings, and motion detectors.
Since Kentik NMS supports this capability, you’ll want to make sure you’ve noted the following:
- The exact OID involved
- Any transformations that have been done to it (Celsius to Fahrenheit, for example)
- The devices this OID was assigned to
It’s also important to note that sometimes you’ll find custom OIDs that don’t seem useful or essential on their own but – when combined – create a more complex value or insight. So, ultimately, it’s a good idea to note all the custom OIDs being collected just in case.
Beyond the device

As the 1970s advertising cliche goes, “But that’s not all!” Along with device-centric data, you’ll want to ensure you’ve captured and documented a range of other monitoring objects before closing the door on your current monitoring solution.
While details on each of these appear below, the shopping list version is as follows:
- Custom properties
- Groups
- Discovery settings
- Users
- Polling engines
- SMTP servers
- Ticket system settings
- Dashboards
- Reports
- Alerts
Custom properties
Custom properties have become a pivotal aspect of SolarWinds, with the ability to add customizations to nodes, interfaces, volumes, applications, alerts, and more. Other monitoring solutions have their own spin on the idea. Still, the upshot is that these are custom fields associated with an object that lets you extend and enhance your understanding of where that element is, what it does, and how to treat it.
While embodied by the eminently unusable “Manager’s Dog’s Name” custom property, they make more sense when you consider the ability to associate data points like:
- Email(s) for responsible individuals
- Environment (prod, test, QA)
- Latitude/longitude
- Asset tag
In any case, you must take a minute to run reports or database queries to extract both the custom properties and the association with the object(s) to which they belong.
Groups
Most monitoring solutions allow you to group objects together, whether using the aforementioned custom properties or some other mechanism.
Sometimes, the mechanism is part of the device itself (such as if it uses the “location” tag within the SNMP configuration).
However, it’s essential to understand that mechanism and note each device, interface, and object’s various groupings within your monitoring solution.
Discovery settings
In some environments, device discovery is a task done during installation/setup and then rarely revisited. In more volatile or fluid infrastructures, device discovery happens often. If your environment resembles the latter more than the former, you’ll want to export the discovery settings. These can include (but aren’t limited to):
- Standard SNMP community strings, usernames, secrets, etc.
- Subnets that are scanned
- Subnets that are skipped/avoided
- Individual systems that are skipped/avoided
- Discovery schedules – when and how various areas of the infrastructure are scanned.
Users
Because of the powerful insights monitoring solutions provide, most companies like to set up some form of role-based access to the system. Most modern, robust monitoring solutions will support this with various forms of authorization and even synchronization to corporate authentication systems like Active Directory or single sign-on.
The point here is that it’s essential to get an export of all of the individual users, groups, and so on, along with the permissions assigned, so you can replicate it in Kentik NMS.
Polling engines
(and nodes assigned to them)
While the term “polling engine” is SolarWinds-specific, the concept is a common one: Whether you call it a Managed Node, a collector, or something else, we’re talking about a device or piece of software that sits between the physical elements themselves (routers, servers, etc.) and the location of all the data being collected (database, SaaS destination, etc.).
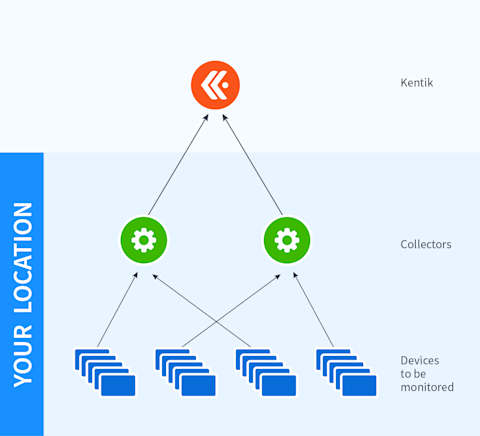
In a sufficiently large environment, you’ll have more objects than a single collector can handle, at which point you’ll need to deploy multiple collectors to handle the load. You’ll also have to determine which collector will be responsible for which endpoints.
Sometimes, this decision is simple because it will follow geographic or logical architectural boundaries. Other times, assignments arise organically and somewhat haphazardly.
Regardless, your task at this migration stage is to record all the collector systems in your environment and identify the objects assigned to each one.
That’s not to say you’ll have to mimic this setup in Kentik NMS. Because of the advances Kentik has made to both the code base and the collection methods, NMS can often collect far more data in a far more efficient manner than tools with a 10+-year-old code base to support.
But despite this, and as we’ve emphasized several times already, it’s critical to know the original setup simply as a point of reference in the future.
SMTP servers
This is a simple item, but people often need to pay more attention to it because it tends to be a set-it-and-forget-it step that happens way back at the installation phase of a monitoring tool and rarely gets touched after that.
Nevertheless, this section is a reminder to go into your platform settings and note the SMTP (email) server or servers used to send out notifications. You’ll want to note the name/IP of the server, the username it connects with (and track down the password that username is associated with because the platform probably won’t show you), the port it uses to connect, etc.
Ticket system settings
Right up there with your email server (SMTP) information is making sure you note the connections to external ticket systems like Remedy, ServiceNow, etc.
This information can vary greatly and is often specific to the ticketing platform and the connection between it and your instance of the current monitoring solution. Therefore, providing a laundry list of things like username, API token, etc., is largely guesswork.
Instead, we’ll keep this section short and remind you to check your current monitoring solution for settings and make a note of them.
In Kentik NMS, you’ll use that information to set up one (or more) notification channels using the built-in integrations or the generic webhook option.
Dashboards
If we’re being honest, most IT practitioners have a love-hate relationship with dashboards. On the one hand, they’re excellent tools to get an “at-a-glance” sense of the overall health and performance of a collection of systems. On the other hand, they’re only good if A) you have it built, B) you know it exists and can find it, and C) someone looks at it when something goes wrong.
The challenge is that A above tends to lead to an overabundance of dashboards being created ad hoc, which in turn leads to B and C—not knowing the dashboard you need exists because there are so many of them. This creates a deadly feedback loop where more dashboards are created simply because nobody knew something like it existed.
Philosophical issues aside, our point is to carefully consider each dashboard in your current system and ask yourself who needs it, for what purpose, and whether another dashboard in your inventory might not serve the same purpose.
After that bit of soul-searching, documenting each dashboard often comes down to identifying which sub-elements (sometimes called “graphs,” “widgets,” or “panels” by various monitoring tool vendors) are part of the overall dashboard. Those sub-elements are almost always created with a query, which means what you really are collecting are those queries and the displays they create.
This has a positive effect because you’ll end up with a list of queries/displays, allowing you to identify overlaps, close matches, and duplicates and simplify your overall environment.
The other positive outcome is that those queries are much easier to translate into Kentik NMS and turn into dashboard elements in the new system.
Reports
This is one of the easier items to understand and check off your list.
First, for SolarWinds, reports are kept in \Program Files (x86)\SolarWinds\Orion\Reports directory on the primary polling engine.
But even so, many tools allow you to output the query behind the report. And, of course, a copy of the reports often gives you almost everything you need to know to set them up in the new system.
Alerts
For many people, alerts are one of the key reasons for having an observability solution. Therefore, it is critical to ensure that you both know what alerts existed in your previous system and can replicate those alerts in the new one.
Other solutions may or may not have a system as simple as SolarWinds. On that platform, you go to Alert Manager, select the alert(s) you need, and then select “Export” from the menus. The result will be an XML file that contains all the relevant information.
Creating alerts within Kentik NMS will be a different process. However, more than any other asset, alerts should not be created via a bulk import process. As we will delve into later in this series, alerts should be carefully considered, purpose-built, and created within Kentik NMS to fit entirely within the Kentik platform’s conceptual framework.
A quick word about query-based elements
Before proceeding to the next section, we encourage you to consider deeply the elements of your monitoring solution that use or rely on queries. In most systems, these include alerts, reports, and dashboards.
Consider that your monitoring solution collects a significant volume of data, and every item mentioned above will query the database.
Indeed, every time a report is run, it generates one (or more) query to pull the relevant data.
But equally, every refresh of a dashboard screen triggers multiple queries as each sub-element pulls and graphs the associated telemetry.
However, alerts are perhaps the most misunderstood element regarding their impact. Every alert has a “trigger,” which is, in fact, a query. That query has to be run regularly—every half hour, every minute, or every 10 seconds—to determine whether any systems meet the trigger query parameters. Thus, if you have 200 alerts set to the (SolarWinds) default of running every minute, you are automatically running 200 database queries every minute.
The result on a sufficiently large database is a hopelessly (and uselessly) slow and unresponsive system.
Therefore, we encourage you to consider the inventory you just spent time collecting and look with a sober eye at what can be left behind.
Stepping back and looking ahead
That wraps up part one of our Migration Made Easy series. If you’d like an even more detailed look at what goes into gathering the required information for a NMS migration, download our entire NMS Migration Guide. (Along with a handy checklist to make your transition smoother.) And if you’re considering moving from SolarWinds, you can learn more about why Kentik NMS is the modern, ideal alternative to SolarWinds.
Until next time.

