Kentik is known for empowering those responsible for the performance of critical network infrastructure with the tools to answer any questions about network performance. It wasn’t that long ago that we introduced Kentik Synthetics to help extend monitoring beyond actual network traffic to test traffic. Over the past year we’ve been rapidly releasing new features for our synthetics product line, including industry-leading BGP monitoring.
Businesses depend on the performance of their applications to protect their brands and to grow. Generally, synthetic monitoring is the active process of simulating visitor or network traffic to a network-accessible resource to test for availability, response time and other performance metrics. These synthetic tests can be targeted at all layers of the stack, including the network, routing and application layers.
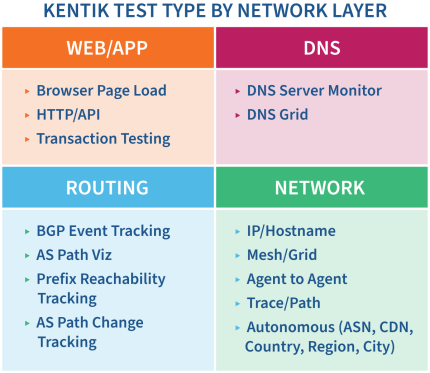
Kentik continues to move up the stack to give customers full visibility of any issues that may be impacting users’ experience. We now have added the ability to perform page load tests and synthetic transaction monitoring to our Kentik Synthetics offering.
Page load tests
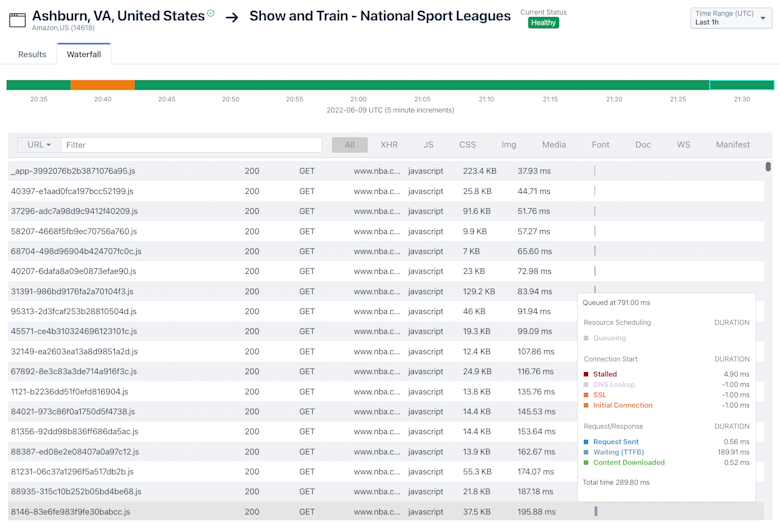
A synthetic page load test involves generating traffic to a site and evaluating the load performance of each element of a page. The load order and load duration of each element in the Document Object Model (DOM) of a page, tested with a page load test, is presented in a waterfall graph.
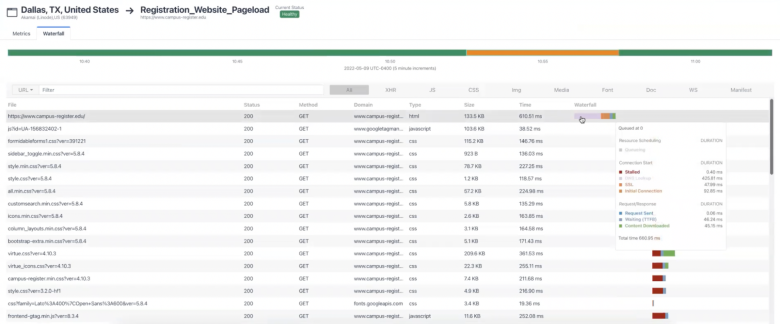
The Kentik Synthetics page load testing capability gives you:
- Response times for various page load stages
- The ability to see Document Object Model processing time
- Measurements of navigation and app cache timing
- HTTP stages performance metrics
- The ability to add ping and trace tests for network metrics
- Kentik page load testing gives you an accurate picture of your users’ digital experience.
Synthetic transaction monitoring (STM)
STM goes deeper than page load testing as the performance of the property being monitored usually requires some form of data entry, such as a login, before other resources can be accessed. For instance, every e-commerce site has many internal and third-party components which enable a customer to shop, including login, search, recommendation engine, product catalog, payment and delivery options. Delays or errors in any of these steps can impact the customer experience and lead to lost revenue. STM will enable you to benchmark the performance of each of these elements and troubleshoot specific performance issues.
Synthetic transaction monitoring use cases
Most use cases for STM fall into two categories:
- Testing the responsiveness of the steps in an app that you own from various geographic regions. An example is that you want to simulate your customers’ experience in your e-commerce store from dispersed geographies.
- Testing from your locations to a set of commonly used apps. The best example of this use case is a multi-location corporation that wants to monitor the response times of apps used by employees at different locations/offices, such as Zoom and Microsoft Office.
Steps to perform STM in Kentik
- Mimic the actions of your users as they would log into your application and perform a transaction.
- Records these actions using Chrome DevTools.
- Open your Kentik account and create a new Transaction Test in the Synthetics module.
- Paste the script.
- Select the agents (private or public) that you’d like to select from.
- Run the test.
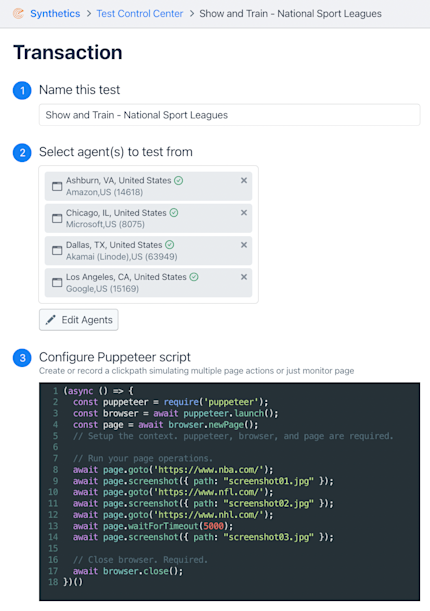
STM tests can be set as both automatic and periodic on time intervals. Users are able to test from hundreds of Kentik public test agents and private agents can easily be deployed.
Kentik STM results
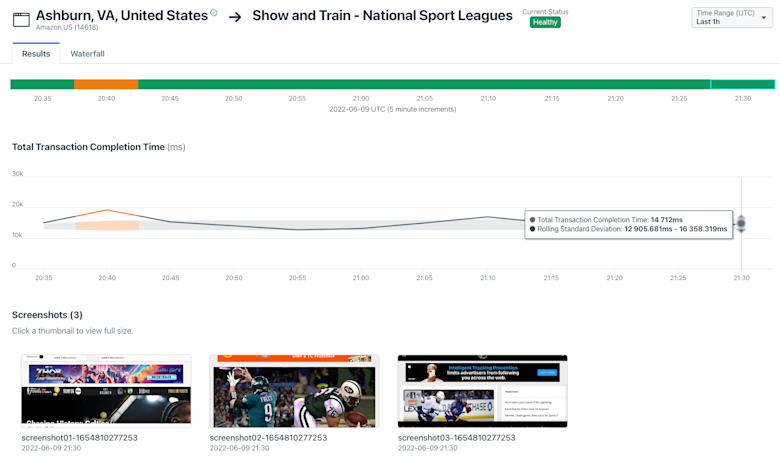
Results of synthetic transaction monitoring tests on a timeline:
- Results are shown over a period of time which you can edit.
- Lags in performance are colored – orange is a warning and red is critical, measured against static or dynamic baselines.
- The graph shows total completion time – selecting a point on the line will indicate total completion time and the rolling standard deviation baseline.
- Screenshots captured during the transaction process are included.
- The Waterfall tab shows the load order and load duration of each element in the DOM of every page visited.
Start a trial – no obligation
Kentik Synthetics is available for a 30-day free trial. Our own public agents are available for you to test from so there’s no heavy integration work to get up and running – in no time you’ll be performing your own STM or page load test. For more information on the Kentik STM capability view this webinar or contact us for a demo.
Monitor user experience
- Performance of user actions through your site/app
- Page load times
- Identify root cause impacting poor app performance
Key capabilities
- Ingest a recorded puppeteer script
- Measure and alert on total transaction time
- Capture screenshots
- Capture a full HAR file in the waterfall view
- Global application agents covering major cloud providers and regions
- Private application agents for Docker, x86 and ARM
- Configurable test frequency
- Intelligent alerting and diagnostics
Key innovations
- Synthetic test results with context of real traffic
- Alerts plus investigation integrated with full network context
- Simple and affordable pricing
Solutions
- Reduce Cloud Spend
- Migrate To and From Any Cloud
- Improve Cloud Performance
- Optimize Enterprise WAN
- Network Performance Monitoring
- Deliver Exceptional Digital Experiences
- Detect and Mitigate DDoS
- Harden Zero-Trust Cloud Network Policy
- Investigate Security Incidents
- Visualize All Cloud and Network Traffic
- Troubleshoot Any Network
- Understand Internet Performance
- Consolidate Legacy Tools
- Optimize Peering and Transit
- Plan Network Capacity


