Transcending MySQL-Based NetFlow Analysis


Summary
For many of the organizations we’ve all worked with or known, SNMP gets dumped into RRDTool, and NetFlow is captured into MySQL. This arrangement is simple, well-documented, and works for initial requirements. But simply put, it’s not cost-effective to store flow data at any scale in a traditional relational database.
Once upon a time, in a network monitoring reality not so far away…
I’ve known a good number of network engineers over time, and for many of the organizations we’ve all worked with or known, network monitoring has been distinctly old school. It’s not because people or the organizations aren’t smart. Quite the contrary—we were all used to building tools from open source software. In fact, that’s how a lot of those businesses were built from the ground up. Only, in network monitoring, there are limits to what can be done by the smart, individual engineer. Here’s a common practice: SNMP gets dumped into RRDTool, an open source data logging and graphing system for time series data. And NetFlow is captured into mysql. This arrangement is attractive to network engineers because it’s simple, well-documented, and works for initial requirements and can grow to some small scale.
When you run a Google search, a top result is a nifty blog post that outlines a fast way to get this approach running with flow-tools, a set of open source flow tools. Compile with the “—with-mysql” configuration option, make a database, and you are off to the pub. If you scroll down below the post, however, you’ll find the following comment:
“have planned.. but it´s not possible for use mysql records… for 5 minutos [minutes] i have 1.832.234 flows … OUCH !!”
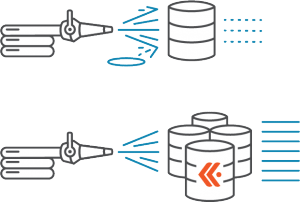
This comment underlines the limitations of applying a general purpose data storage engine to network data. Simply put, it’s not cost effective to store flow data (e.g. NetFlow, sFlow, IPFIX, etc.) at any scale in a traditional relational database.
Why is this so? To begin with, the write volume of flow records (especially during an attack, when you need the info the most) will quickly overwhelm the ingest rate of a single node. Even if you could successfully ingest raw records at scale, your next hurdle would be to calculate topK values on that data. That requires one of two options: either a sequence scan and sort or else maintaining expensive indices, which slow down ingest.

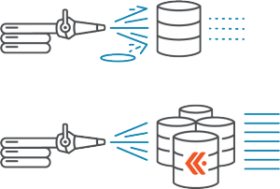
So what’s the solution? Rather than discarding data to accommodate old-school data storage, the smarter approach is to build a data storage system that handles the volume of data you need for effective network visibility. Then you can store trillions of flows/day, enjoy a reasonable sample rate, and run queries spanning a week or more of traffic, which can give you a much fuller view of what’s really going on. That idea — architecting a robust datastore for massive volumes of network data — was a key part of what we set out to do at Kentik as we developed the Kentik Data Engine (KDE), which serves as the backend datastore for Kentik Detect.
If Kentik existed back then…
As I think of the experience of many of my colleagues, we’ve dealt with networks which run multiple, distributed points of presence (PoP). Any organization with that kind of network footprint cares deeply about availability and security. A natural Kentik Detect deployment for this kind of network would be to install the Kentik agent and BGP daemon running locally in a VM in each PoP. The gateway router in each PoP would peer with the BGP daemon while exporting flow data and SNMP data to the agent. The agent would append BGP path data to each flow while also performing GeoIP lookups down to the city level for source and destination IPs. Every second, data for the last second would be sent via HTTPS to Kentik Detect.
There are two major ways that the visibility provided by Kentik Detect would have benefited these networks. First, they would have had a more automated way of dealing with DDoS. Pretty much every significant network was and still is attacked constantly, and we all know stories where members of the operations team sometimes worked 24 to 48 hour shifts to manage the situation. In fact, this phenomenon was a common experience in web, cloud, and hosting companies. Adding insult to injury, sleep deprivation often led to simple mistakes that made things even harder to manage. The ability to automatically detect volumetric DDoS attacks and rate-limit aggressive IPs would had meant way better sleep. It also would have meant way better network operations.
The other benefit of having Kentik Detect would have been the ability to look at long-term trends. Peering analysis can help web companies and service providers save tens to hundreds of thousands of dollars per month in network transit fees. To peer effectively, however, you have to be able to view traffic over a long time-frame. The old-school approach to data storage left us unable to work with a sufficient volume of data. Kentik Detect enables you to analyze months of traffic data, broken out by BGP paths (the series of network IDs each packet traverses when it leaves your network). So, Kentik’s ability to pair BGP paths with flow would have made peering analysis trivial to set up even though it involves looking at billions of flow records behind the scenes. Kentik Detect could have easily picked out the top networks where peering would be most cost effective, and that information could have saved a lot of money.
Of course, what I’m describing isn’t necessarily history for a lot of folks — it’s still reality. If that’s the case for you or someone you know, take a look at how the Kentik Network Observability Cloud can help you get to a better place.


