Summary
Networking in the cloud can be like a black box. In this blog we discuss five essential properties of network observability for cloud, giving you the ability to answer any question about your cloud network.
Understanding network performance in your cloud environment is essential for maintaining cloud application performance and reliability. However, most organizations find that they lose network visibility when they move to the cloud. This blog highlights five critical cloud network monitoring imperatives for cloud engineers to put in place to ensure the health of public and hybrid cloud environments.
Moving to the cloud makes many things easier. The cloud’s flexibility and elasticity allow you to add compute, storage and other resources rapidly, and to scale up and down as your needs change.
Yet to leverage the cloud’s elasticity to the greatest effect, you must be able to manage your network configurations to ensure that performance remains optimal even as your cloud environment scales up and down.
That’s why network observability is critical in the cloud. The cloud makes it easy to change configurations, but not so easy to verify that changes are optimal — especially when it comes to cloud networking, which can involve a multitude of VPCs, gateways and related services.
How do cloud engineers meet these challenges? They start by focusing on five key best practices for achieving network observability across their entire cloud environment — whether it includes just one public cloud, multiple public clouds or a hybrid combination of public and private resources.
Cloud Network Observability Requires Multiple Data Sources
Achieving consistent visibility into your cloud networks requires more than just one data source or set of data points. You need to be able to collect data from multiple facets and layers of your cloud environment, including:
- Flow logs: Flow logs record the granular movement of traffic as it travels between instances, gateways and endpoints within your cloud environment
- Network metrics: Metrics like throughput and utilization allow you to measure the health and reliability of the elements composing your cloud network.
- Metadata: Correlated tags and business metadata such as names or cost information make it easier to contextualize information and understand what you’re observing.
- Synthetic tests: Synthetic testing, which is an efficient means to track performance, helps you find and investigate issues before they grow to become problems for end-users.
- Application metrics: Although applications are not the focus of network observability, they provide important metrics like response duration and error rate, which can be correlated with other data to evaluate the scope and user impact of networking issues.
Business Metadata is Key
Simply collecting data is only the first step toward network observability for cloud. Just as important is the correlation of data to gain context into what is happening — to be able to understand the data you are seeing.
This means not just correlating what applications and workloads are generating the traffic, but also going by bringing in names, costs information and locations.
For example, you need to know quickly whether a network slowdown impacts production environments or is limited to dev/test. The difference will tell you how to prioritize the incident. Likewise, mapping IP addresses to specific business units or users helps you understand network observability trends not just from the perspective of machine data, but from the business.

Traffic Flows in Many Directions. Observe Them All.
In a world where the majority of businesses that use the cloud have or are moving to multiple clouds, and many use a hybrid model, gaining visibility into cloud networks requires a multifaceted approach that tracks traffic flows within and between clouds. Not only that, but you must also be able to monitor traffic flows between different cloud regions and to on-premises.
And again, you need to be able to contextualize all of this traffic flow in terms of business operations. Maybe you use one of your regions in one of your clouds only to host data backups, for instance, whereas another region hosts production data. A slowdown in traffic to the backup region may be less harmful to the business than a networking performance issue with the production region. Context like this is critical for understanding the impact of traffic flow patterns on business operations.
In addition to conventional east-west traffic within a single cloud (or cloud region), you must also measure and analyze north-south traffic as it flows from one cloud data center or your private data center into others.
For new applications developed by engineers who are less familiar with networking practices, it is imperative to spot sub-optimal traffic flows that may introduce unnecessary traffic delays, costs or security risks.
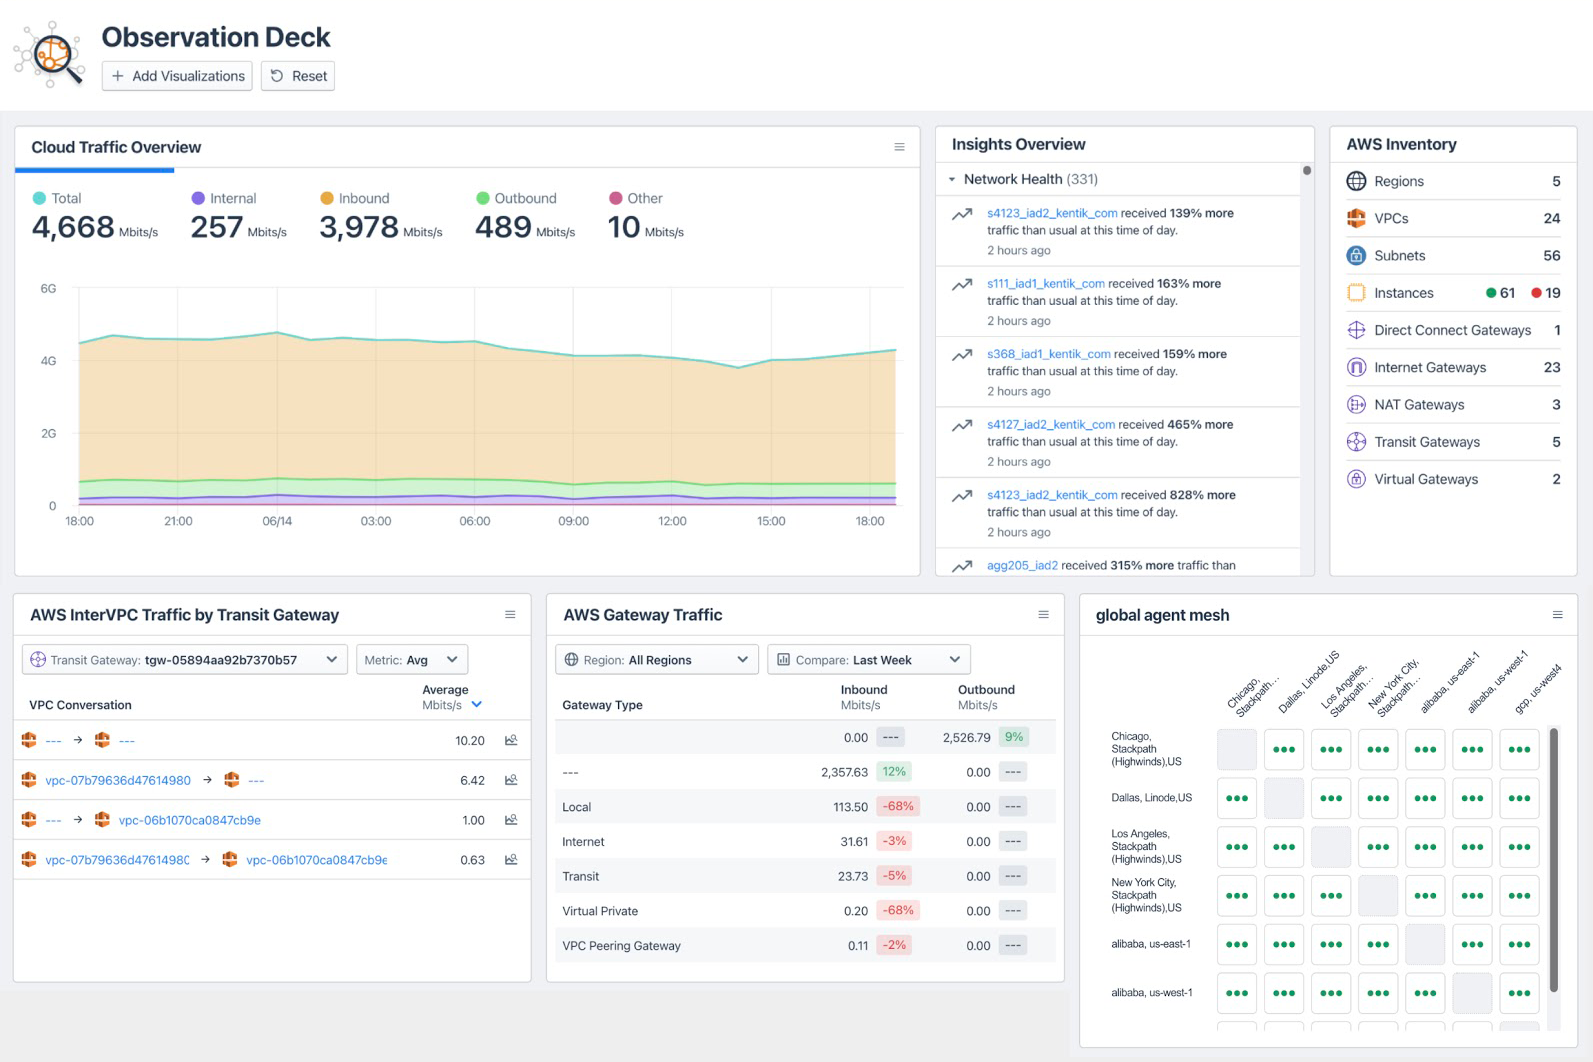
Ask Questions and Visualize Answers
As you measure all of these traffic flows, look not just for minimum and maximum metrics thresholds in order to establish a baseline of normal activity, but also for anomalies that could reveal a network performance or security issue. You’ll want to be able to answer questions such as:
- Why did a spike in traffic occur? Is it congestion, an attack, an application issue or something else?
- How did a change in a cloud service configuration impact traffic flows associated with that service?
- How does a networking configuration change impact application response time and error rates?
- How much am I spending on cloud egress, and how do networking changes correlate with my egress bill?
- Which clouds or regions are generating and receiving the most traffic?
Remember, too, that because egress plays a big role in your cloud computing bill, you’ll want to identify top talkers and top spenders — meaning resources that generate the highest amounts of traffic and associated egress costs — in order to help manage your network spend. Ask questions and visualize answers As you analyze cloud network data, take a question-and-answer approach to interpret the data and understand its impact on the business.
For a longer discussion of questions to ask yourself as you observe your network, and tips on where to find the answers, check out our blog on network telemetry types.
A Data Platform Capable of Supporting the Data That You Need
Using a SaaS-based solution for cloud network observability has some distinct advantages. SaaS gives you flexibility in accessing data from the services you need and deploying any network agents that you need to gather telemetry data quickly and easily. SaaS also gives you the ability to gather all of your network temetery data into a single platform optimized for network data. And, because the service is cloud-based, scalability and performance can grow easily with the need.
Delivering a capable network observability service for cloud requires some unique attributes. First, the data platform needs to be optimized for high-cardinality data. Network telemetry comes in dozens of types and hundreds of attributes, and each attribute can have millions of unique values. Second, the SaaS-based platform needs to support massive multi-tenancy. Operational data telemetry platforms need to be able to support dozens of queries. Not just from interactive users via the UI or API, but from other operational systems within the network stack and across an organization’s operational systems. Finally, users need to be able to ask complex questions and get answers in seconds, not hours, to support modern ‘trail of thought’ diagnostic workflows — thus the need for immediate query results.
Conclusion
Maintaining network observability in the cloud requires a fundamentally different approach than engineers take to monitoring networks within a single data center. Not only do cloud teams need to collect more types of data, but they must also be able to correlate and contextualize them in order to associate performance issues with different parts of their networks. Visualization is critical, too, for making sense of the complex flows and layers that shape cloud network performance. And finally, you need a data platform that is capable of supporting the unique requirements of network observability data.


