Summary
NetFlow data has a lot to tell you about the traffic across your network, but it may require significant resources to collect. That’s why many network managers choose to collect flow data on a sampled subset of total traffic. In this post we look at some testing we did here at Kentik to determine if sampling prevents us from seeing low-volume traffic flows in the context of high overall traffic volume.
Seeing a Needle in the Traffic Haystack
Network flow data (e.g., NetFlow, sFlow, IPFIX) is often used to gain visibility into the characteristics of IP traffic flowing through network elements. This data — flow records or datagrams, depending on the protocol — is generated by network devices such as routers and switches. Equivalent to PBX “call detail records” from the world of telephony, flow data is metadata that summarizes the IP packet flows that make up network traffic. In this post we’ll look at why flows are sampled and explore how visibility is impacted by the rate at which total flows are sampled to collect flow records for monitoring and analysis.
Sampling: What and Why
When a network device monitors flows and produces flow records, it’s consuming resources such as CPU and memory. Those resource requirements can be significant for devices that are deployed on networks with high volumes of traffic. A high-volume stream of flow records can also be challenging for monitoring/management systems to ingest on the receiving end. Consequently, network devices typically aren’t configured to capture every flow. Instead, traffic is sampled to make the load at both ends more manageable. With sampling enabled, network devices generate flow records from a random 1-in-N subset of the IP traffic packets. The value of N is chosen based on the overall volume of traffic passing through the device. It can range from as low as 100 for devices passing around 1 Gbps of traffic to as high as 50,000 for devices that pass about 1 Tbps of traffic. As N increases, the flow records derived from the samples may become less representative of the actual traffic, especially of low-volume flows over short time-windows. In the real world, how high can N be while still enabling us to see a given traffic subset that is a relatively small part of the overall volume? To get a sense of the limits, we decided to set up a test.
A Sampling Test Environment
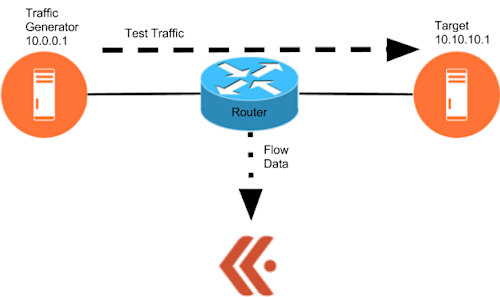
Our test involves sending low-volume test traffic across a device with relatively high overall traffic volume to see if we can pick out the test traffic against the backdrop of the existing traffic. The test is conducted using the setup shown in the following image. As traffic passes through the router on its way from the generator to the target, the router collects flow records and sends them to Kentik, our big data network visibility solution. The unsummarized flow data is ingested in real time into the Kentik Data Engine (our scale-out backend) where it’s ready for ad hoc analytics and visualization.

In the following image from the Kentik portal, the sampling column (at right) of the Device List shows that the device, named “test_router,” is configured to sample 1 in 10000 packets.

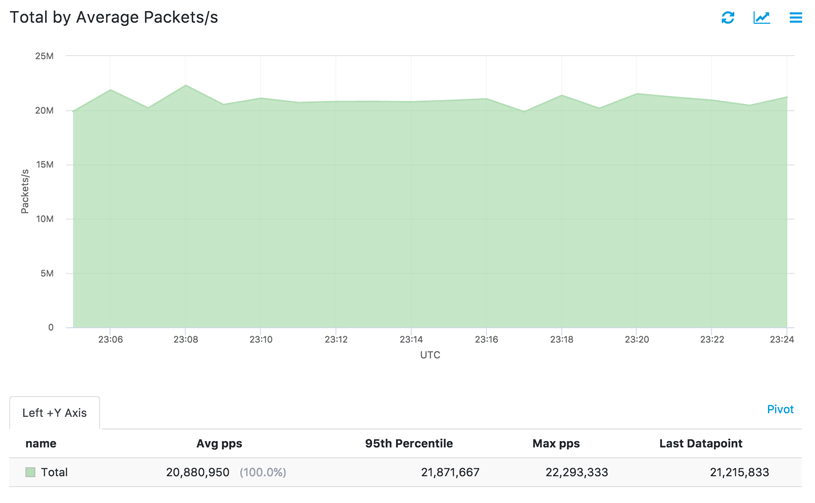
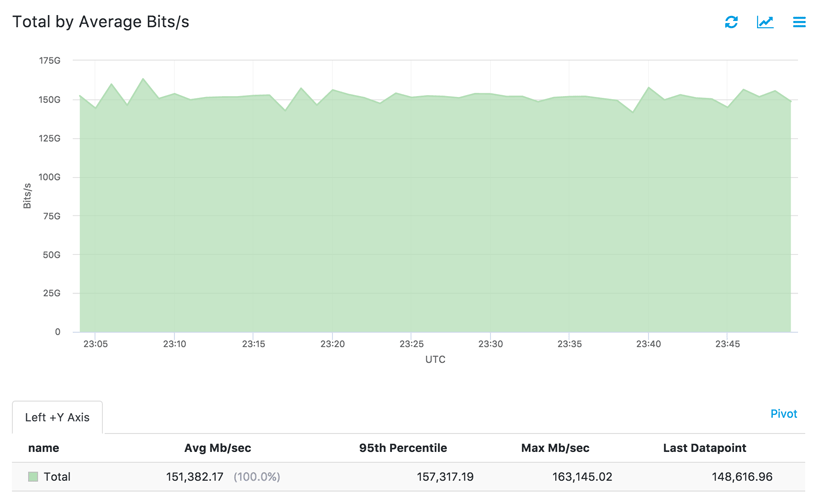
As shown in the following graphs from the Kentik portal, the baseline traffic volume forwarded by test_router is 20 Mpps (first image) or 150 Gbps (second image).


Generating Test Traffic
We generate test traffic with a simple python script using Scapy, a packet crafting library. The script generates randomized TCP packets toward our test target, and also prints the pps rate every second.
from scapy.all import \* import socket import time from timeit import default_timer as timer s = conf.L2socket(iface="eth0") count = 0 oldtime = timer() while True: count += 1 newtime = timer() if (newtime - oldtime) >= 1: print time.ctime() + ': ' + str(round(count / (newtime - oldtime))) oldtime = newtime count = 0 pe=Ether()/IP(dst="10.10.10.1")/fuzz(TCP()) s.send(pe)
Running the script, we can see that it is generating roughly 560 packets/second, which represents a very low volume of traffic compared to the total being forwarded by this router.
Thu May 4 23:59:50 2017: 546.0 Thu May 4 23:59:51 2017: 561.0 Thu May 4 23:59:52 2017: 568.0 Thu May 4 23:59:53 2017: 577.0 Thu May 4 23:59:54 2017: 575.0 Thu May 4 23:59:55 2017: 568.0 Thu May 4 23:59:56 2017: 565.0 Thu May 4 23:59:57 2017: 568.0 Thu May 4 23:59:58 2017: 572.0 Thu May 4 23:59:59 2017: 573.0
Test Traffic Observation

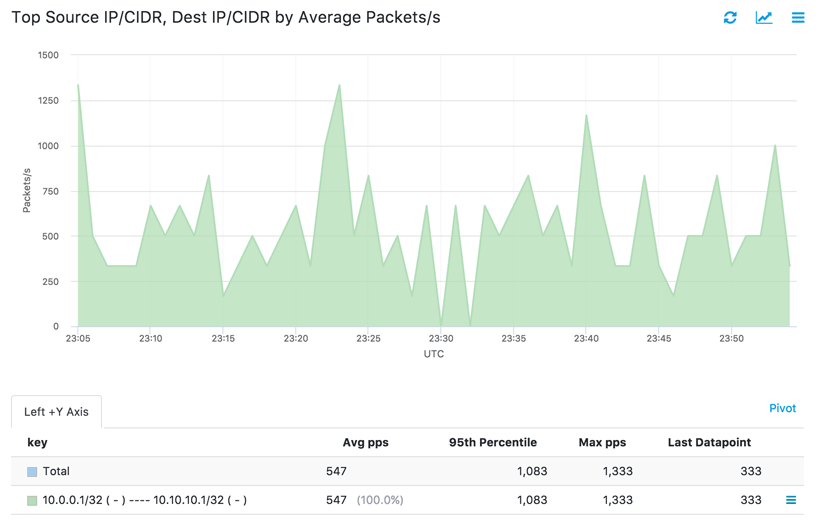
Now let’s see if the small volume of test traffic is discernible against the large volume of overall traffic. To do so, we’ll add a two-dimension filter in Data Explorer, Kentik’s primary ad hoc query environment. The filter narrows our view to just the traffic going from the traffic generator to the test target. When we run a query using this filter, with the metric set to show packets/second, we get the following graph and table.

The graph has a definite sawtooth pattern induced by the sampling rate, but the traffic is clearly visible. We can see from the Avg pps column of the table that over a relatively short window, the average (547 pps) has converged to a value very close to the known rate of 560 pps that the script is sending.
Conclusion
These initial test results show that it is possible to measure small “needle-in-a-haystack” traffic flows at relatively high sampling intervals (high N) with accuracy that is adequate for all common use cases. To quantify the parameters more precisely, we plan additional testing on the effects of various sample rates on data reporting accuracy. Check back for future posts on this topic. In the meantime, you can learn more about how Kentik helps you see and optimize your network traffic by scheduling a demo. Or explore on your own by signing up today for a free trial; in 15 minutes you could be looking at your own traffic via the Kentik portal.
