Anatomy of an OTT Traffic Surge: The Fortnite Chapter 2 Remix Update

Summary
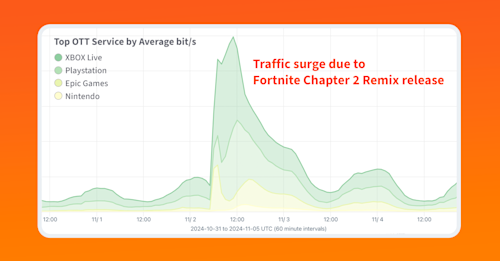
On Saturday, November 2, the wildly popular video game Fortnite released its latest game update: Fortnite Chapter 2 Remix. The result was a surge of traffic as gaming platforms around the world downloaded the latest update for the seven-year-old game. Doug Madory looks at how the resulting traffic surge can be analyzed using Kentik’s OTT Service Tracking.
Some of the internet’s biggest traffic surges these days involve the global distribution of software updates for popular video games. The latest such event occurred on Saturday when Epic Games released its latest update for Fortnite, one of the world’s most popular games. The Fortnite Chapter 2 Remix update caused a massive spike in traffic levels for many service providers.
Let’s analyze this traffic surge using Kentik’s OTT Service Tracking…
OTT Service Tracking
Kentik’s OTT Service Tracking (part of Kentik Service Provider Analytics) combines DNS queries with NetFlow to allow a user to understand exactly how OTT services are being delivered — an invaluable capability when trying to determine what is responsible for the latest traffic surge. Whether it is a Call of Duty update or a the first-ever exclusively live-streamed NFL playoff game, these OTT traffic events can put a lot of load on a network and understanding them is necessary to keep a network operating at an optimal level.
The capability is more than simple NetFlow analysis. Knowing the source and destination IPs of the NetFlow of a traffic surge isn’t enough to decompose a networking incident into the specific OTT services, ports, and CDNs involved. DNS query data is necessary to associate NetFlow traffic statistics with specific OTT services in order to answer questions such as, “What specific OTT service is causing my peering link with a certain CDN to become saturated?”
Kentik True Origin is the engine that powers OTT Service Tracking workflow. True Origin detects and analyzes the DNA of over 540 categorized OTT services and providers and more than 50 CDNs in real time, all without the need to deploy DPI (deep packet inspection) appliances behind every port at the edge of the network.
The Nitty “Griddy”
Kentik customers using OTT Service Tracking observed the following statistics, illustrated below. When measured in bits/sec, 56% of the traffic during the surge was delivered over the Xbox Live platform, 28.4% through Playstation and 14.4% sent directly from Epic Games, the publisher of Fortnite.
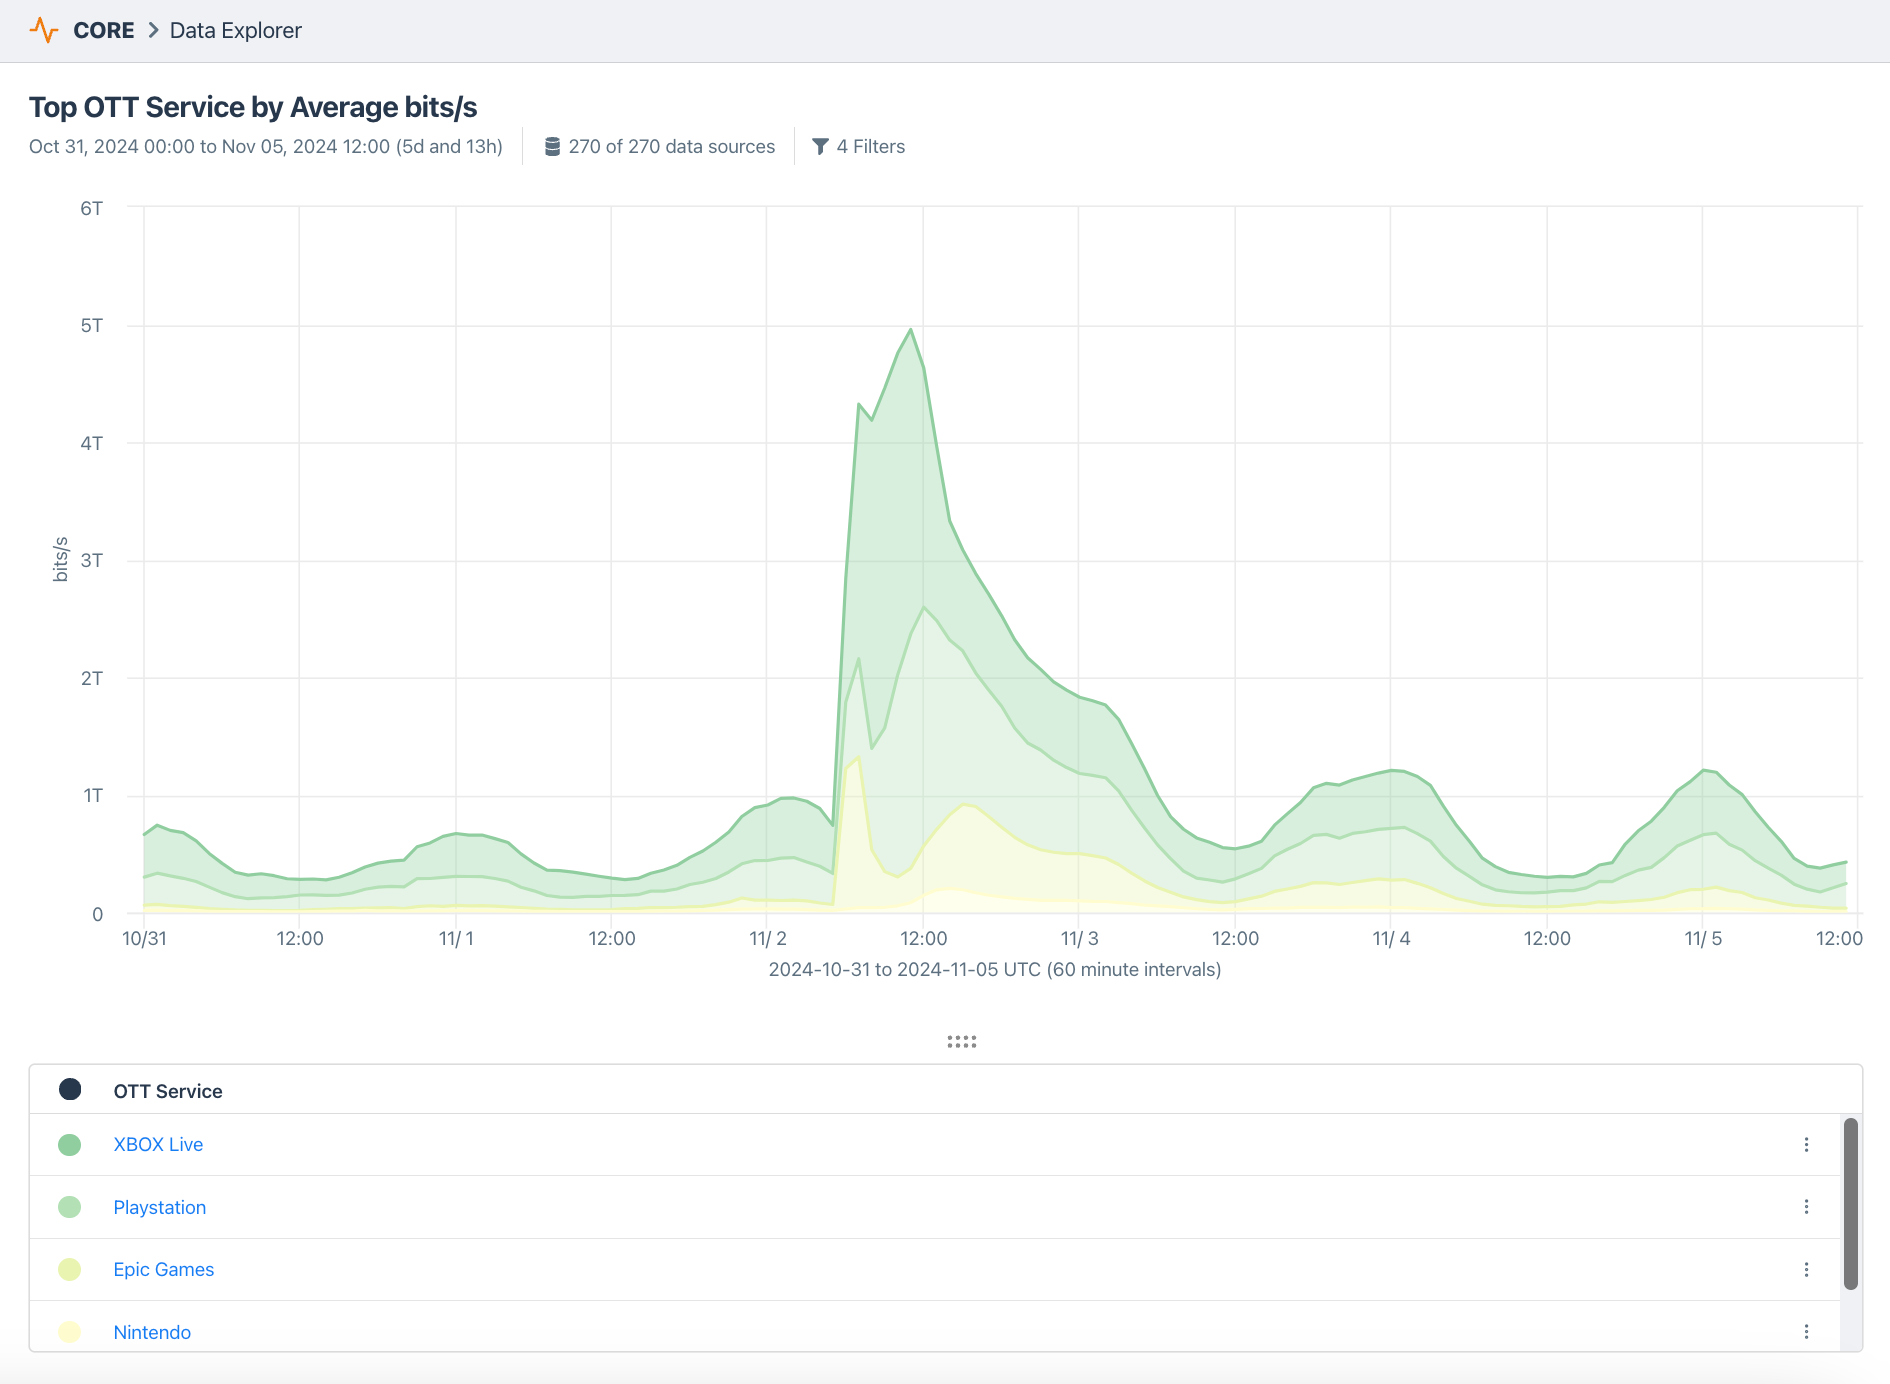
When broken down by Connectivity Type (below), Kentik customers received the Snoop Dogg-themed update from a variety of sources including Private Peering (72.8%, both free and paid), Transit (12.8%), IXP (11.3%) and Embedded Cache (1.9%).
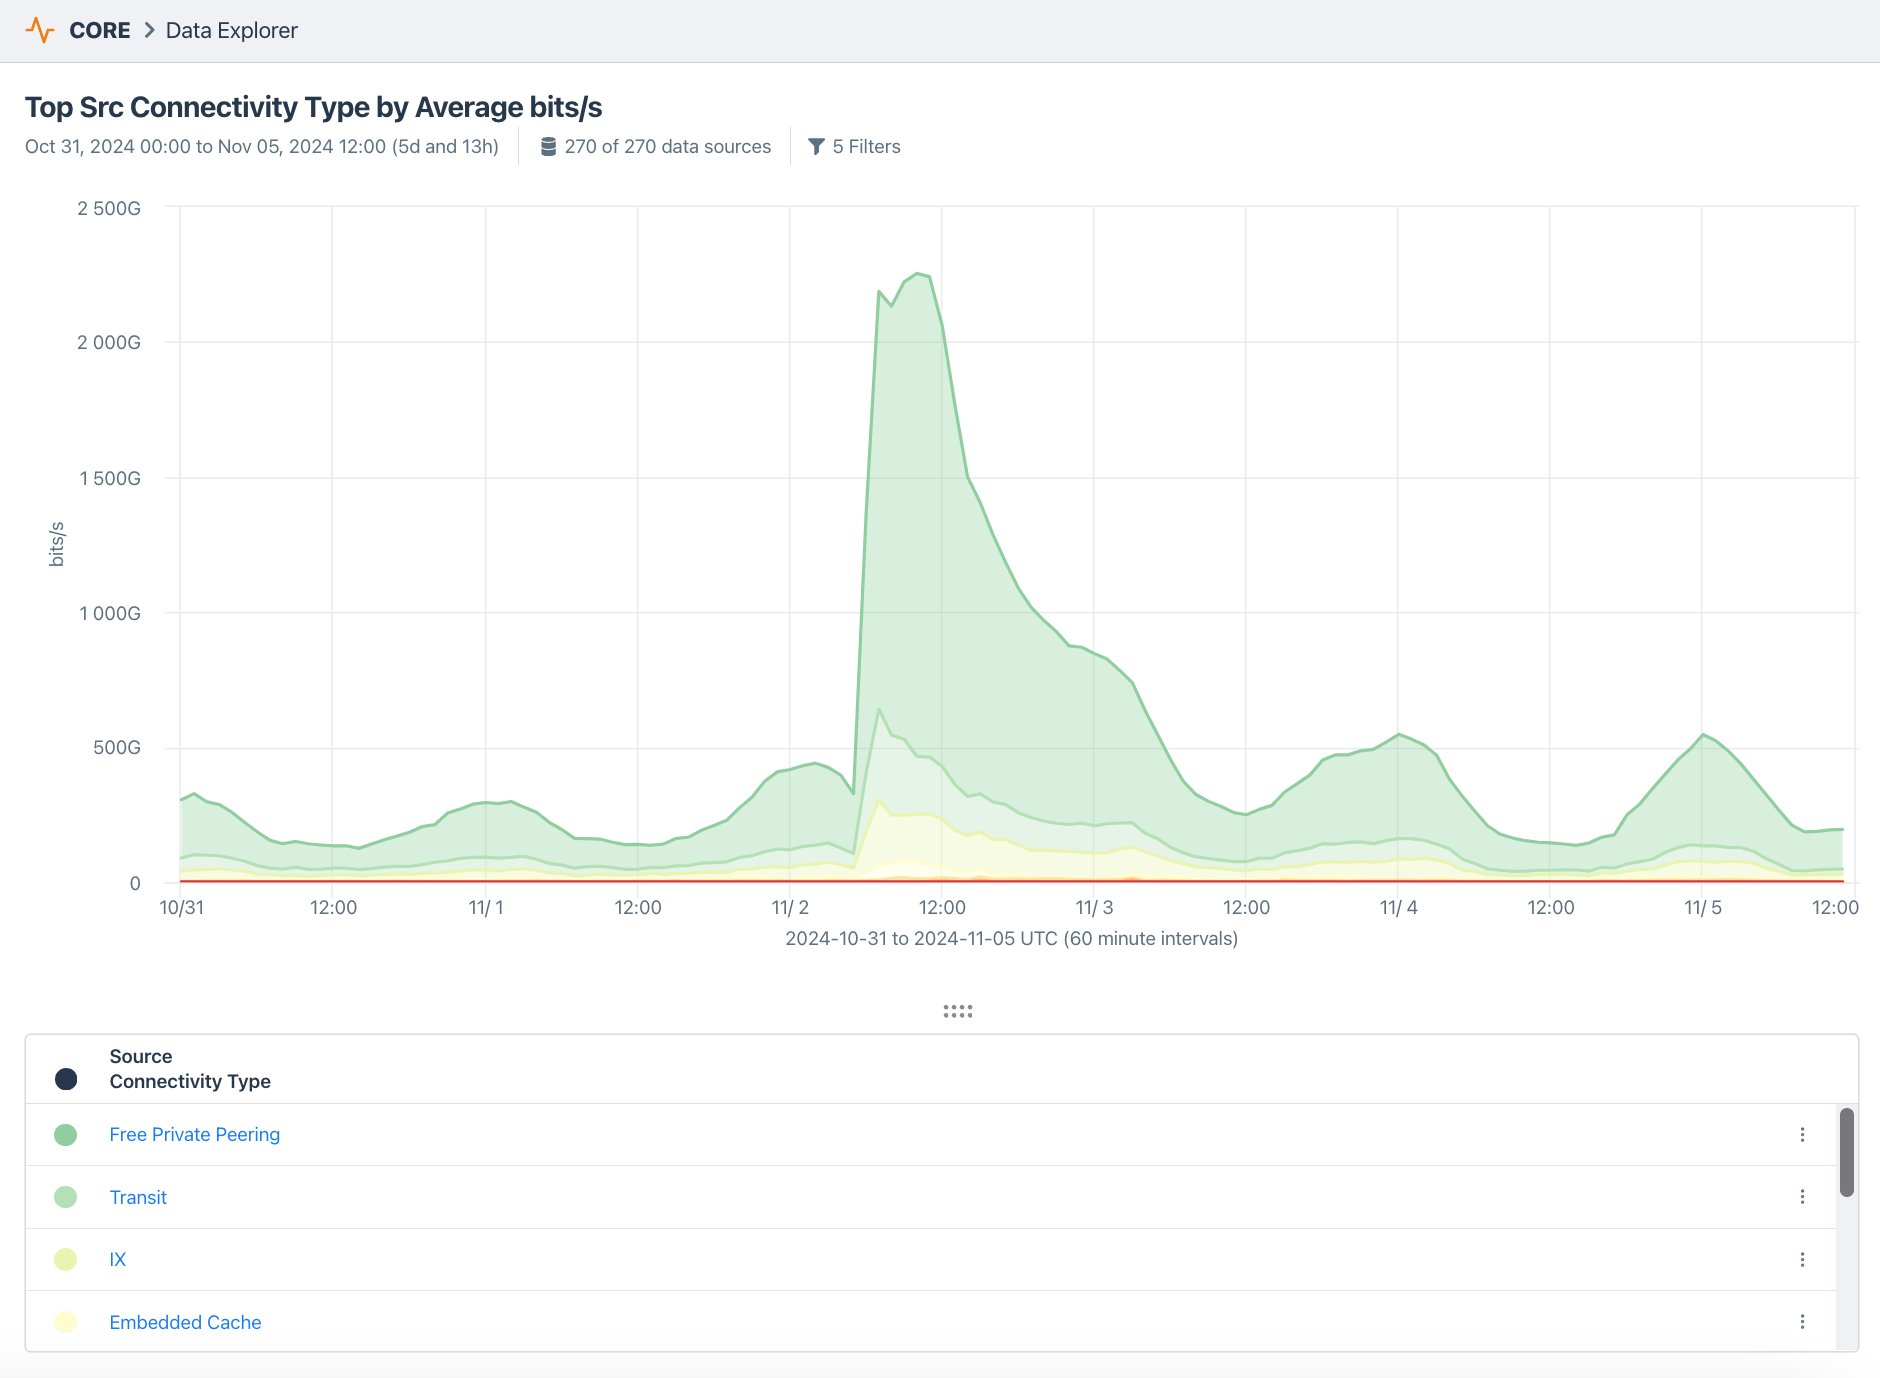
The update caused a traffic peak that was over 15 times what was observed at the same time the previous day. It was delivered via a variety of content providers including Fastly (41.7%), Akamai (22.1%), Amazon (10%), Cloudflare (8.9%) with Edgecast and Qwilt delivering the remaining bits/sec.
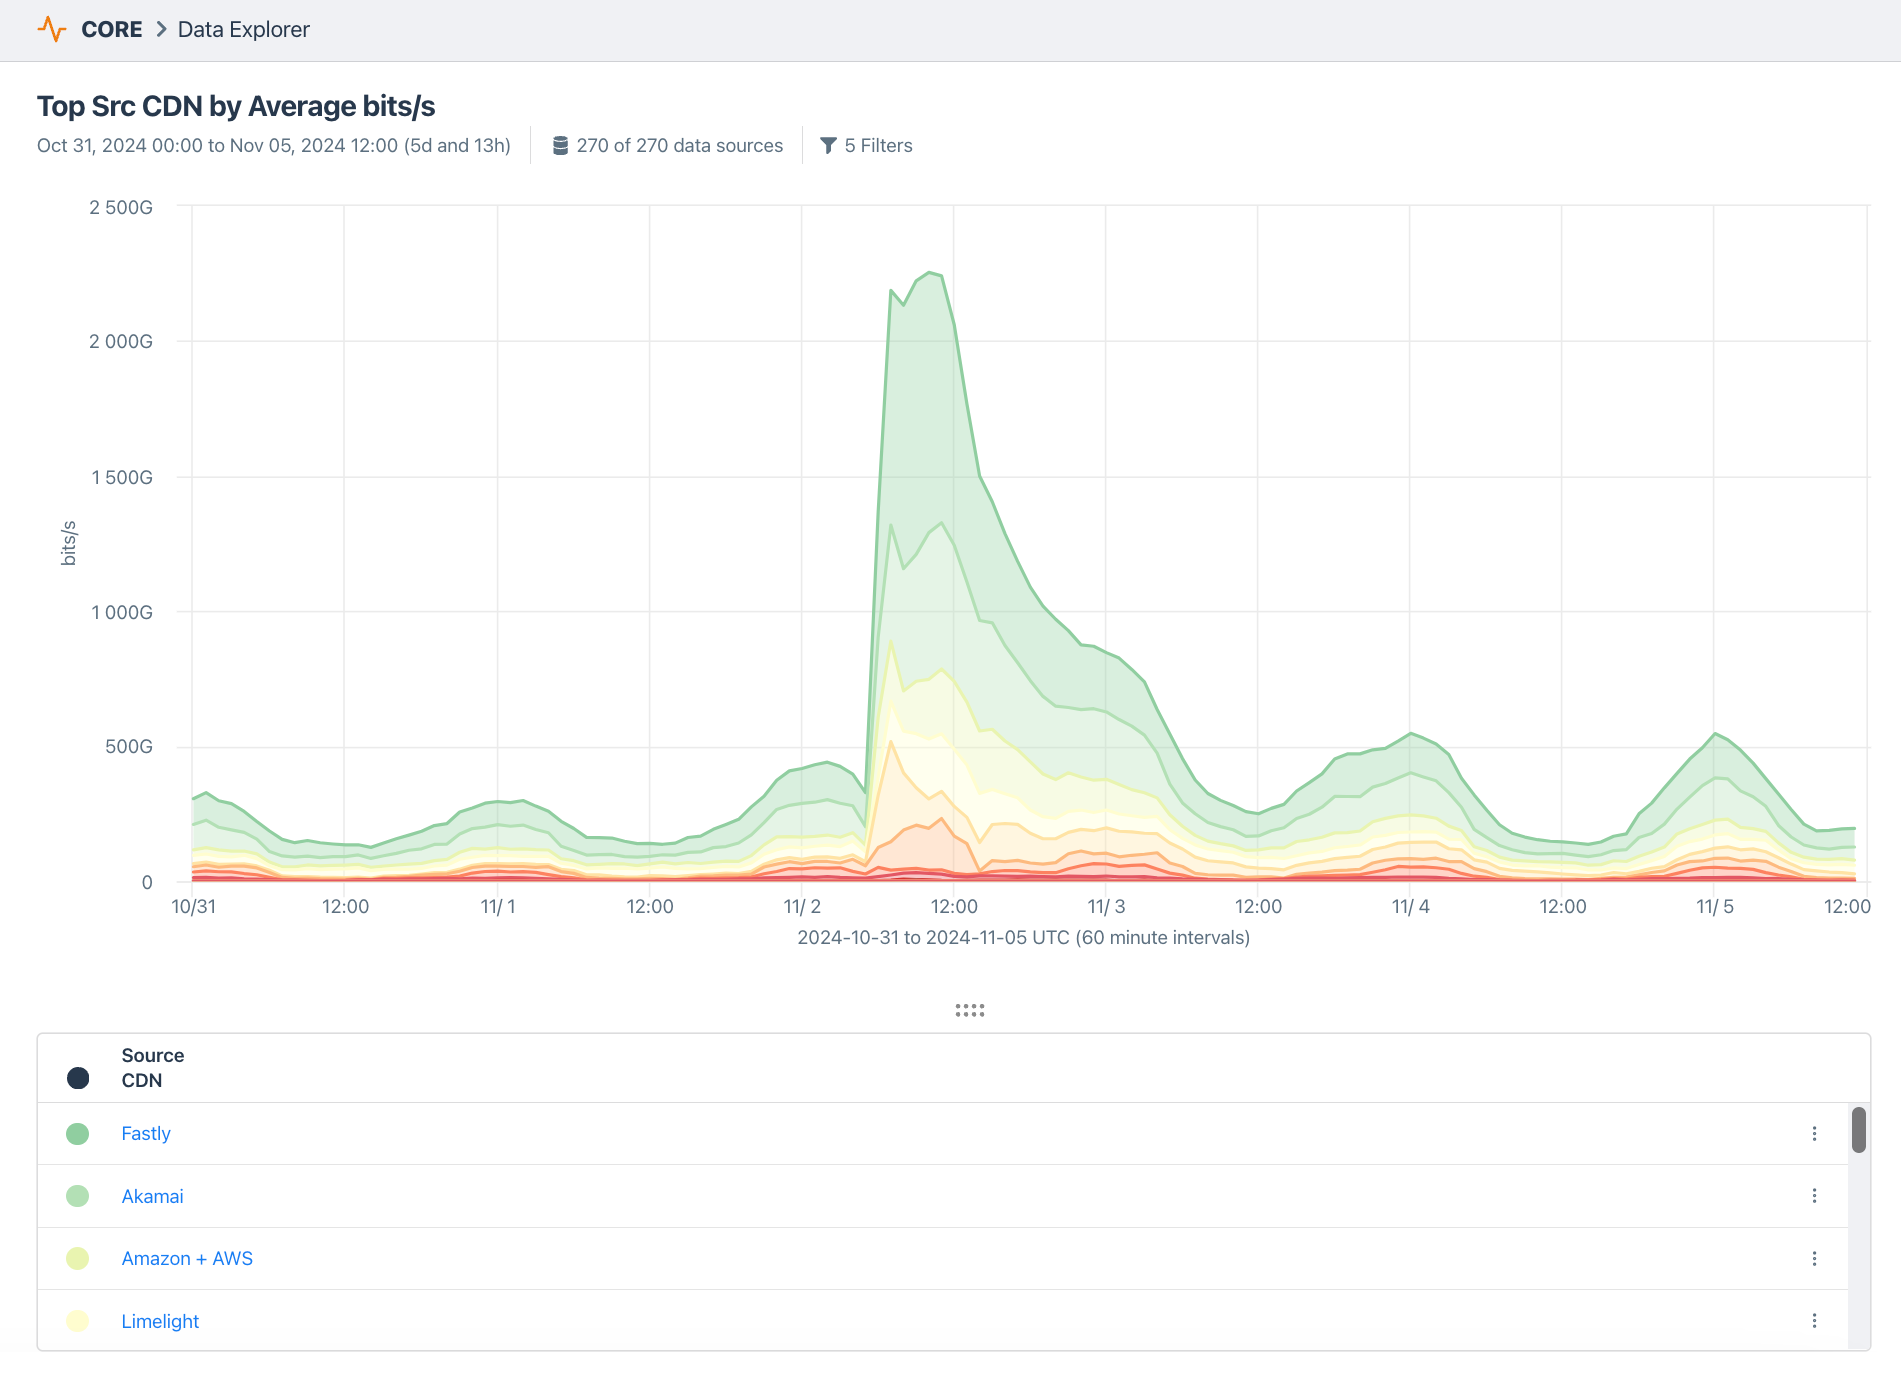
In addition to source CDN and connectivity type, users of Kentik’s OTT Service Tracking are also able to break down traffic volumes by subscribers, specific router interfaces and customer locations.
How does OTT Service Tracking help?
Previously, my colleague Greg Villain described enhancements to our OTT Service Tracking workflow which allows providers to plan and execute what matters to their subscribers, including:
- Maintaining competitive costs
- Anticipating and fixing subscriber OTT service performance issues
- Delivering sufficient inbound capacity to ensure resilience
Major traffic events like Microsoft’s Patch Tuesday can have impacts in all three areas. OTT Service Tracking is the key to understanding and responding when they occur. Learn more about the application of Kentik for subscriber intelligence.
Ready to improve over-the-top service tracking for your own networks? Get a personalized demo.
