Posts by Leon Adato


About Leon Adato
Leon Adato is a principal technical evangelist at Kentik, and has held multiple industry certifications during his 33 years in IT including Cisco, Microsoft, A+, and more. His experience spans financial, healthcare, food and beverage, and other industries.
Before coming to Kentik, he was a speaker and blogger in the monitoring and observability space for more than a decade. His IT career began in 1989 and has led him through roles in classroom training, desktop support, sysadmin, and network engineering.
Leon has been with network monitoring for more than two decades, working with a wide range of tools: Tivoli, Nagios, Patrol, ZenOss, janky perl scripts, OpenView, SiteScope, SolarWinds, Grafana, Zabbix, New Relic, and (of course) Kentik. In the course of that work, he’s designed solutions for companies that ranged in size from modest (~10 systems); to significant (1,000 – 5,000 systems); to ludicrous (250,000 systems in 5,000 locations).
Leon Adato takes a lighthearted and personal look back at 2024, reflecting on the standout moments and trends that caught his eye throughout the year. In his signature off-the-cuff style, Leon shares his unique perspective on the past year’s highlights.
Are you considering the switch from network engineer to cloud engineer? This post won’t teach you everything needed to become a cloud expert, but hopefully, it will create a level of comfort and familiarity such that you can start your journey to the cloud from here.
Testing NetFlow used to require time, expertise, and lab equipment. Using Kentik and the new Kappa agent, it can be done in minutes with nothing more than a spare Linux machine.
The network is the metaphorical plumbing through which all your precious non-metaphorical observability and monitoring data flows. It holds secrets you’ll never find anywhere else. And it’s more important today than ever before.
In this post, I’m going to point out some of the opportunities you have in front of you not only because you now have Kentik NMS up and running, but more importantly, as a result of all the hard work you did to get here.
The time has come to switch to your new network monitoring solution. Remember, if an alert, report, ticket, or notification does not spark joy, get rid of it. We’ll cover how to spin up Kentik NMS and ensure you’re ready to sunset your old solution for good.
Migrating network monitoring solutions is more than just a list of devices and technical requirements. It’s also about ensuring that all stakeholders are aligned - from team members to customers and everyone in between.
Network monitoring tools have a lot of moving parts. Those parts end up getting stored in a wide range of locations, formats, and even the ways various capabilities are conceptualized. With that in mind, we’re going to list out the information you should gather, the format(s) you should try to get it into, and why.
NMS can do so much that one blog topic triggered an idea for another, and another, and here we are, six posts later and I haven’t explained how to install NMS yet. The time for that post has come.
Leon takes a look at how to further modify SNMP metrics in Kentik NMS. Because sometimes, you want to modify data before displaying it in your network monitoring system. Ready? Let’s get mathy with it!
Kentik NMS has the ability to collect multiple SNMP objects (OIDs). Whether they are multiple unrelated OIDs, or multiple elements within a related table, Leon Adato walks you through the steps to get the data out of your devices and into your Kentik portal.
Kentik NMS collects valuable network data and then transforms it into usable information — information you can use to drive action.
Out of the gate, NMS collects an impressive array of metrics and telemetry. But there will always be bits that need to be added. This brings me to the topic of today’s blog post: How to configure NMS to collect a custom SNMP metric.
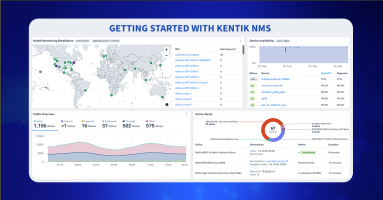
Kentik NMS is here to provide better network performance monitoring and observability. Read how to get started, from installation and configuration to a brief tour of what you can expect from Kentik’s new network monitoring solution.
Kentik NMS has launched and is setting sail in familiar waters. Monitoring with SNMP and streaming telemetry is only the first leg of the journey. In short order, we’ll unfurl additional options, increasing NMS’s velocity and maneuverability.
Despite the siren song of AI in the keynotes, visitors were far more focused on solving real-world problems. These are the issues that have plagued IT practitioners for years, if not decades: troubleshooting and validating performance and availability of their applications, services, and infrastructure.
Kubecon 2023 was more than just another conference to check off my list. It marked my first chance to work in the booth with my incredible Kentik colleagues. It let me dive deep into the code, community, and culture of Kubernetes. It was a moment when members of an underrepresented group met face-to-face and experienced an event previously not an option.
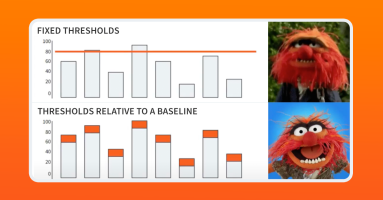
The entire reason we have monitoring is to understand what users are experiencing with an application. Full stop. If the user experience is impacted, sound the alarm and get people out of bed if necessary. All the other telemetry can be used to understand the details of the impact. But lower-level data points no longer have to be the trigger point for alerts.
The most noticeable takeaway from All Things Open 2023 was how visibly and demonstrably people were there for the event itself. Not to check a box or browse the swag but to be together, show their support of open source, and glean every last bit of knowledge they could.
If there’s anything I’ve learned, monitoring data is the lifeblood of the business and a superpower for any IT practitioner. Monitoring allows organizations to react to changes, identify and recover, and understand the true health of the business.


