Posts by Phil Gervasi


About Phil Gervasi
Phil is a veteran engineer with over a decade of experience in the field troubleshooting, building, and designing networks. Phil is also an avid blogger and podcaster with an interest in emerging technology and making the complex easy to understand. Check out the latest episodes of the Telemetry Now podcast where Phil and his expert guests talk networking, network engineering and related careers, emerging technologies, and more.
By applying data engineering and machine learning to raw network telemetry, it’s possible to surface insights that would otherwise go unnoticed. Learn how this approach helps teams detect anomalies in real time, forecast capacity needs, and automate responses across complex, multi-domain environments.
AI is a hot topic right now, but it’s only valuable when it drives action. The real goal is business intelligence—insight that’s timely, trustworthy, and tied to decisions that move the business forward.
While AI offers powerful benefits for network operations, building an in-house AI solution presents major challenges, particularly around complex data engineering, staffing specialized roles, and maintaining models over time. The effort required to handle real-time telemetry, retrain models, and manage evolving environments is often too great for most IT teams. For enterprise networks, partnering with a vendor that specializes in AI and network operations is typically a more efficient, scalable, and sustainable approach.
AI can be a transformative tool in network operations — but only when it’s tied to clear, measurable outcomes. Rather than chasing hype, IT and NetOps teams should focus on solving specific operational challenges like reducing MTTR, cutting costs, and stabilizing infrastructure. AI has real potential when strategically applied, and when aligned with business goals, it becomes a powerful ally in modern network operations.
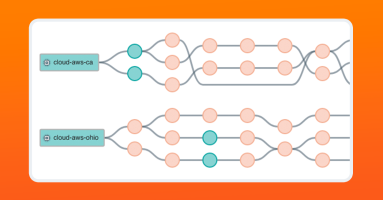
Cloud Pathfinder simplifies cloud troubleshooting by visually mapping connectivity paths between cloud endpoints and integrating the power of AI, identifying where and why traffic is being blocked. By analyzing cloud configuration metadata, it provides instant, actionable insights into routing and security issues — saving engineers hours of manual work.
AWS NAT Gateways are essential for private subnet access but can quickly become a costly burden, even when idle. With Kentik, cloud and network engineers gain deep visibility into NAT Gateway traffic, allowing them to identify underutilized gateways, analyze high-cost usage, and explore cost-saving alternatives like VPC Endpoints, Internet Gateways, or direct peering. By optimizing traffic routing and eliminating unnecessary NAT Gateway expenses, teams can significantly reduce cloud networking costs while improving efficiency.
Cloud networking costs can escalate due to inefficient routing and limited visibility. Kentik’s cloud visibility and analytics solution helps engineers optimize transit, reduce costs, and improve performance by analyzing AWS Transit Gateways and exploring alternatives like direct peering, storage endpoints, and AWS CloudWAN.
AI has the power to optimize network performance, detect anomalies, and improve capacity planning, but its effectiveness depends on high-quality data. Without a strong data foundation, AI remains a theoretical tool rather than delivering real operational value.
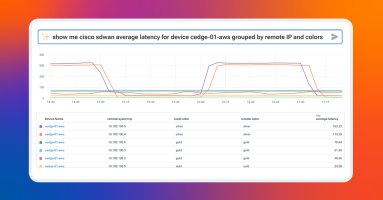
In this post, discover how Kentik Journeys integrates large language models to revolutionize network observability. By enabling anyone in IT to query and analyze network telemetry in plain language, regardless of technical expertise, Kentik breaks down silos and democratizes access to critical insights simplifying complex workflows, enhancing collaboration, and ensuring secure, real-time access to your network data.
Azure VNet flow logs significantly improve network observability in Azure. Compared to NSG flow logs, VNet flow logs provide broader traffic visibility, enhanced encryption status monitoring, and simplified logging at the virtual network level enabling advanced traffic analysis and a more comprehensive solution for modern cloud network management.
AWS VPC flow Logs and Azure NSG flow Logs offer network traffic visibility with different scopes and formats, but both are essential for multi-cloud network management and security. Unified network observability solutions analyze both in one place to provide comprehensive insights across clouds.
In today’s multi-cloud landscape, maintaining smooth and reliable connectivity requires complete visibility into cloud networks. With Kentik, network and cloud engineers gain the tools to monitor, visualize, and optimize Azure traffic flows, from ExpressRoute circuits to application performance, ensuring efficient and proactive operations.
Kentik Data Explorer is a powerful tool designed for engineers managing complex environments. It provides comprehensive visibility across various cloud platforms by ingesting and enriching telemetry data from sources like AWS, Google Cloud, and Azure, and with the ability to explore data through granular filters and dimensions, engineers can quickly analyze cloud performance, detect security threats, and control costs in real-time exploration and historically.
In today’s complex cloud environments, traditional network visibility tools fail to provide the necessary context to understand and troubleshoot application performance issues. In this post, we delve into how network observability bridges this gap by combining diverse telemetry data and enriching it with contextual information.
In this post, we look at optimizing cloud network routing to avoid suboptimal paths that increase latency, round-trip times, or costs. To mitigate this, we can adjust routing policies, strategically distributing resources, AWS Direct Connects, and by leveraging observability tools to monitor performance and costs, enabling informed decisions that balance performance with budget.
In this post, explore the challenges of diagnosing network traffic blockages in AWS due to the complex and dynamic nature of cloud networks. Learn how Kentik addresses these issues by integrating AWS flow data, metrics, and security policies into a single view, allowing engineers to quickly identify the source of blockages enhancing visibility and speeding up the resolution process.
AWS Transit Gateway costs are multifaceted and can get out of control quickly. In this post, discover how Kentik can help you understand and control the network traffic driving AWS Transit Gateway costs. Learn how Kentik can help you understand traffic patterns, optimize data flows, and keep your Transit Gateway costs in check.
While CloudWatch offers basic monitoring and log aggregation, it lacks the contextual depth, multi-cloud integration, and cost efficiency required by modern IT operations. In this post, learn how Kentik delivers more detailed insights, faster queries, and more cost-effective coverage across various cloud and on-premises resources.
Migrating to public clouds initially promised cost savings, but effective management now requires a strategic approach to monitoring traffic. Kentik provides comprehensive visibility across multi-cloud environments, enabling detailed traffic analysis and custom billing reports to optimize cloud spending and make informed decisions.
Dubbed “The man who can see the internet” by the Washington Post, Doug Madory has made significant contributions to the field of internet measurement. In this post, we explore how internet measurement works and what secrets it can uncover.
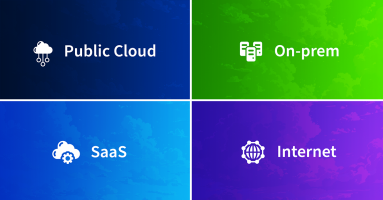
Multi-cloud visibility is a challenge for most IT teams. It requires diverse telemetry and robust network observability to see your application traffic over networks you own, and networks you don’t. Kentik unifies telemetry from multiple cloud providers and the public internet into one place to give IT teams the ability to monitor and troubleshoot application performance across AWS, Azure, Google, and Oracle clouds, along with the public internet, for real-time and historical data analysis.
Hybrid cloud environments, combining on-premises resources and public cloud, are essential for competitive, agile, and scalable modern networks. However, they bring the challenge of observability, requiring a comprehensive monitoring solution to understand network traffic across different platforms. Kentik provides a unified platform that offers end-to-end visibility, crucial for maintaining high-performing and reliable hybrid cloud infrastructures.
Today’s evolving digital landscape requires both hybrid cloud and multi-cloud strategies to drive efficiency, innovation, and scalability. But this means more complexity and a unique set of challenges for network and cloud engineers, particularly when it comes to managing and gaining visibility across these environments.
AI has been on a decades-long journey to revolutionize technology by emulating human intelligence in computers. Recently, AI has extended its influence to areas of practical use with natural language processing and large language models. Today, LLMs enable a natural, simplified, and enhanced way for people to interact with data, the lifeblood of our modern world. In this extensive post, learn the history of LLMs, how they operate, and how they facilitate interaction with information.
Streaming telemetry is the future of network monitoring. Kentik NMS is a modern network observability solution that supports streaming telemetry as a primary monitoring mechanism, but it also works for engineers running SNMP on legacy devices they just can’t get rid of. This hybrid approach is necessary for network engineers managing networks in the real world, and it makes it easy to migrate from SNMP to a modern monitoring strategy built on streaming telemetry.
Kentik Journeys uses an AI-based, large language model to explore data from your network and troubleshoot problems in real time. Using natural language queries, Kentik Journeys is a huge step forward in leveraging AI to democratize data and make it simple for any engineer at any level to analyze network telemetry at scale.
Is SNMP on life support, or is it as relevant today as ever? The answer is more complicated than a simple yes or no. SNMP is reliable, customizable, and very widely supported. However, SNMP has some serious limitations, especially for modern network monitoring — limitations that streaming telemetry solves. In this post, learn about the advantages and drawbacks of SNMP and streaming telemetry and why they should both be a part of a network visibility strategy.
Modern networking relies on the public internet, which heavily uses flow-based load balancing to optimize network traffic. However, the most common network tracing tool known to engineers, traceroute, can’t accurately map load-balanced topologies. Paris traceroute was developed to solve the problem of inferring a load-balanced topology, especially over the public internet, and help engineers troubleshoot network activity over complex networks we don’t own or manage.
Is there a gap between the potential of network automation and widespread industry implementation? Phil Gervasi explores how the adoption challenges of network automation are multifaceted and aren’t all technical in nature.
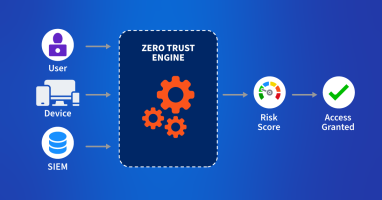
Zero trust in the cloud is no longer a luxury in the modern digital age but an absolute necessity. Learn how Kentik secures cloud workloads with actionable views of inbound, outbound, and denied traffic.
Managing modern networks means taking on the complexity of downtime, config errors, and vulnerabilities that hackers can exploit. Learn how BGP Flow Specification (Flowspec) can help to mitigate DDoS attacks through disseminating traffic flow specification rules throughout a network.
CloudWatch can be a great start for monitoring your AWS environments, but it has some limitations in terms of granularity, customization, alerting, and integration with third-party tools. In this article, learn all the ways that Kentik can supercharge your AWS performance monitoring and improve visibility.
With the increasing reliance on SaaS applications in organizations and homes, monitoring connectivity and connection quality is crucial. In this post, learn how with Kentik’s State of the Internet, you can dive deep into the performance metrics of the most popular SaaS applications.
Traditional data center networking can’t meet the needs of today’s AI workload communication. We need a different networking paradigm to meet these new challenges. In this blog post, learn about the technical changes happening in data center networking from the silicon to the hardware to the cables in between.
Tools and partners can make or break the cloud migration process. Read how Box used Kentik to make their Google Cloud migration successful.
Artificial intelligence is certainly a hot topic right now, but what does it mean for the networking industry? In this post, Phil Gervasi looks at the role of AI and LLM in networking and separates the hype from the reality.
In this post, Phil Gervasi uses the power of Kentik’s data-driven network observability platform to visualize network traffic moving globally among public cloud providers and then perform a forensic analysis after a major security incident.
The scalability, flexibility, and cost-effectiveness of cloud-based applications are well known, but they’re not immune to performance issues. We’ve got some of the best practices for ensuring effective application performance in the cloud.
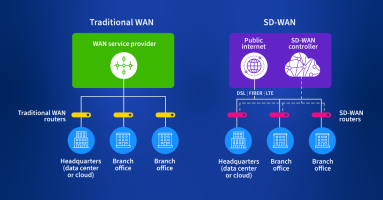
SD-WAN is a reliable, fast, and secure WAN network. In this guide, you’ll learn some best practices for planning, monitoring, analyzing, and managing modern SD-WANs.
Discover how Kentik’s network observability platform aids in troubleshooting SaaS performance problems, offering a detailed view of packet loss, latency, jitter, DNS resolution time, and more. Phil Gervasi explains how to use Kentik’s synthetic testing and State of the Internet service to monitor popular SaaS providers like Microsoft 365.
Today’s modern enterprise WAN is a mix of public internet, cloud provider networks, SD-WAN overlays, containers, and CASBs. This means that as we develop a network visibility strategy, we must go where no engineer has gone before to meet the needs of how applications are delivered today.
We access most of the applications we use today over the internet, which means securing global routing matters to all of us. Surprisingly, the most common method is through trust relationships. MANRS, or the Mutually Agreed Norms for Routing Security, is an initiative to secure internet routing through a community of network practitioners to facilitate open communication, accountability, and the sharing of information.
Virtual Private Cloud (VPC) flow logs are essential for monitoring and troubleshooting network traffic in an AWS environment. In this article, we’ll guide you through the process of writing AWS flow logs to an S3 bucket.
In this post, learn about what a UDR is, how it benefits machine learning, and what it has to do with networking. Analyzing multiple databases using multiple tools on multiple screens is error-prone, slow, and tedious at best. Yet, that’s exactly how many network operators perform analytics on the telemetry they collect from switches, routers, firewalls, and so on. A unified data repository unifies all of that data in a single database that can be organized, secured, queried, and analyzed better than when working with disparate tools.
What do network operators want most from all their hard work? The answer is a stable, reliable, performant network that delivers great application experiences to people. In daily network operations, that means deep, extensive, and reliable network observability. In other words, the answer is a data-driven approach to gathering and analyzing a large volume and variety of network telemetry so that engineers have the insight they need to keep things running smoothly.
A data-driven approach to cybersecurity provides the situational awareness to see what’s happening with our infrastructure, but this approach also requires people to interact with the data. That’s how we bring meaning to the data and make those decisions that, as yet, computers can’t make for us. In this post, Phil Gervasi unpacks what it means to have a data-driven approach to cybersecurity.
eBPF is a powerful technical framework to see every interaction between an application and the Linux kernel it relies on. eBPF allows us to get granular visibility into network activity, resource utilization, file access, and much more. It has become a primary method for observability of our applications on premises and in the cloud. In this post, we’ll explore in-depth how eBPF works, its use cases, and how we can use it today specifically for container monitoring.
Under the waves at the bottom of the Earth’s oceans are almost 1.5 million kilometers of submarine fiber optic cables. Going unnoticed by most everyone in the world, these cables underpin the entire global internet and our modern information age. In this post, Phil Gervasi explains the technology, politics, environmental impact, and economics of submarine telecommunications cables.
What does it mean to build a successful networking team? Is it hiring a team of CCIEs? Is it making sure candidates know public cloud inside and out? Or maybe it’s making sure candidates have only the most sophisticated project experience on their resume. In this post, we’ll discuss what a successful networking team looks like and what characteristics we should look for in candidates.
Today’s enterprise WAN isn’t what it used to be. These days, a conversation about the WAN is a conversation about cloud connectivity. SD-WAN and the latest network overlays are less about big iron and branch-to-branch connectivity, and more about getting you access to your resources in the cloud. Read Phil’s thoughts about what brought us here.
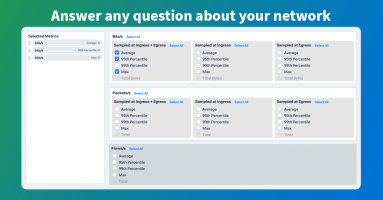
A cornerstone of network observability is the ability to ask any question of your network. In this post, we’ll look at the Kentik Data Explorer, the interface between an engineer and the vast database of telemetry within the Kentik platform. With the Data Explorer, an engineer can very quickly parse and filter the database in any manner and get back the results in almost any form.
The advent of various network abstractions has meant many day-to-day networking tasks normally done by network engineers are now done by other teams. What’s left for many networking experts is the remaining high-level design and troubleshooting. In this post, Phil Gervasi unpacks why this change is happening and what it means for network engineers.
Traffic telemetry is the foundation of network observability. Learn from Phil Gervasi on how to gather, analyze, and understand the data that is key to your organization’s success.
Collecting and enriching network telemetry data with DevOps observability data is key to ensuring organizational success. Read on to learn how to identify the right KPIs, collect vital data, and achieve critical goals.
Does flow sampling reduce the accuracy of our visibility data? In this post, learn why flow sampling provides extremely accurate and reliable results while also reducing the overhead required for network visibility and increase our ability to scale our monitoring footprint.
Machine learning has taken the networking industry by storm, but is it just hype, or is it a valuable tool for engineers trying to solve real world problems? The reality of machine learning is that it’s simply another tool in a network engineer’s toolbox, and like any other tool, we use it when it makes sense, and we don’t use it when it doesn’t.
Most of the applications we use today are delivered over the internet. That means there’s valuable application telemetry embedded right in the network itself. To solve today’s application performance problems, we need to take a network-centric approach that recognizes there’s much more to application performance monitoring than reviewing code and server logs.
We’re fresh off KubeCon NA, where we showcased our new Kubernetes observability product, Kentik Kube, to the hordes of cloud native architecture enthusiasts. Learn about how deep visibility into container networking across clusters and clouds is the future of k8s networking.
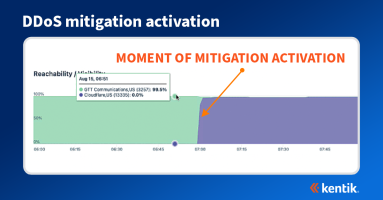
At first glance, a DDoS attack may seem less sophisticated than other types of network attacks, but its effects can be devastating. Visibility into the attack and mitigation is therefore critical for any organization with a public internet presence. Learn how to use Kentik to see the propagation of BGP announcements on the public internet before, during, and after the DDoS attack mitigation.
A packet capture is a great option for troubleshooting network issues and performing digital forensics, but is it a good option for always-on visibility considering flow data gives us the vast majority of the information we need for normal network operations?
There is a critical difference between having more data and more answers. Read our recap of Networking Field Day 29 and learn how network observability provides the insight necessary to support your app over the network.
At Networking Field Day: Service Provider 2, Steve Meuse showed how Kentik’s OTT analysis tool can help a service provider better understand the services running on their network. Doug Madory introduced Kentik Market Intelligence, a SaaS-based business intelligence tool, and Nina Bargisen discussed optimizing peering relationships.
Investigating a user’s digital experience used to start with a help desk ticket, but with Kentik’s Synthetic Transaction Monitoring, you can proactively simulate and monitor a user’s interaction with any web application.
The theme of augmenting the network engineer with diverse data and machine learning really took the main stage at the World of Solutions. Read Phil Gervasi’s recap.
By peeling back layers of your users’ interactions, you can investigate what’s going on in every aspect of their digital experience — from the network layer all the way to application.
When something goes wrong with a service, engineers need much more than legacy network visibility to get a complete picture of the problem. Here’s how synthetic monitoring helps.
In the old days, we used a combination of several data types, help desk tickets, and spreadsheets to figure out what was going on with our network. Today, that’s just not good enough. The next evolution of network visibility goes beyond collecting data and presenting it on pretty graphs. Network observability augments the engineer and finds meaning in the huge amount of data we collect today to solve problems faster and ensure service delivery.


