Kentik Blog: Digital Experience Monitoring


With the increasing reliance on SaaS applications in organizations and homes, monitoring connectivity and connection quality is crucial. In this post, learn how with Kentik’s State of the Internet, you can dive deep into the performance metrics of the most popular SaaS applications.
API monitoring is the process of keeping tabs on the performance of your REST APIs. Learn how Kentik’s API monitoring tools let you identify bottlenecks, spot performance drops, and maintain API availability. Learn more in this API monitoring how-to tutorial.
There is a critical difference between having more data and more answers. Read our recap of Networking Field Day 29 and learn how network observability provides the insight necessary to support your app over the network.
Investigating a user’s digital experience used to start with a help desk ticket, but with Kentik’s Synthetic Transaction Monitoring, you can proactively simulate and monitor a user’s interaction with any web application.
Kentik goes up the stack and launched Synthetic Transaction Monitoring (STM). Read this post to learn about enhancements to our synthetic testing capability and how to perform STM in Kentik.
By peeling back layers of your users’ interactions, you can investigate what’s going on in every aspect of their digital experience — from the network layer all the way to application.
With Kentik Synthetics, New Relic gains proactive insights about network performance and can ensure its customers have a reliable digital experience.
When something goes wrong with a service, engineers need much more than legacy network visibility to get a complete picture of the problem. Here’s how synthetic monitoring helps.
In the second post of this multi-part series, Kentik’s Anil Murty will share how Kentik Synthetics helps you proactively monitor applications and services and troubleshoot the root cause of issues faster.
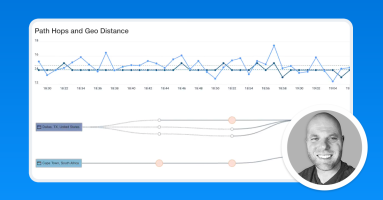
In this post, learn how to isolate the root cause of a poor digital experience. See why it’s important to measure performance of a website from multiple different locations and observe the metrics over time.
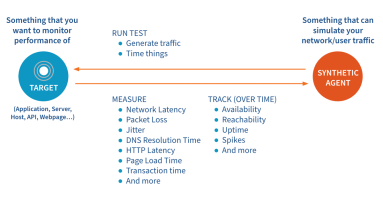
Synthetic monitoring can help you proactively track the performance and health of your networks, applications and services. In the first post of this multi-part series, Kentik’s Anil Murty will share how synthetic monitoring can also help you drive better business outcomes.
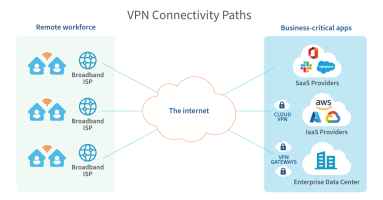
A company with thousands of remote employees connecting to the same SaaS applications will randomly experience slowness. How can we troubleshoot this sluggishness?
