A Demo: Pinpointing an Abnormal Traffic Spike in Under 5 Minutes
Summary
For NetOps and SecOps teams, alarms typically mean many more hours of work ahead. That doesn’t have to be the case. In this post, we look at how to troubleshoot an abnormal traffic spike and get to root cause in under five minutes.
Imagine you are an ops guy or gal and it’s your turn in the on-call rotation. Alarms go off in the middle of the night, flooding from everywhere, via slack, email, and text messages. This scenario always leaves you wishing you could spend as little time as possible to discover the problem, fix it, and go back to sleep.
Many readers who understand the complexity of today’s networks are shaking their heads and saying, “Good luck! It’s going to be a long night for that person.” However, things turn out differently when you’re working with Kentik’s modern analytics for all your networks.
In this post, we look at how to troubleshoot an abnormal traffic spike and get to root cause in under five minutes (instead of several hours!).
1. Start from a dashboard
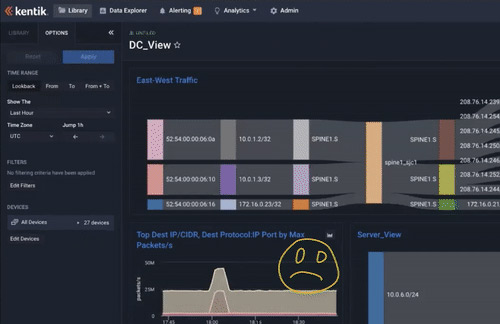
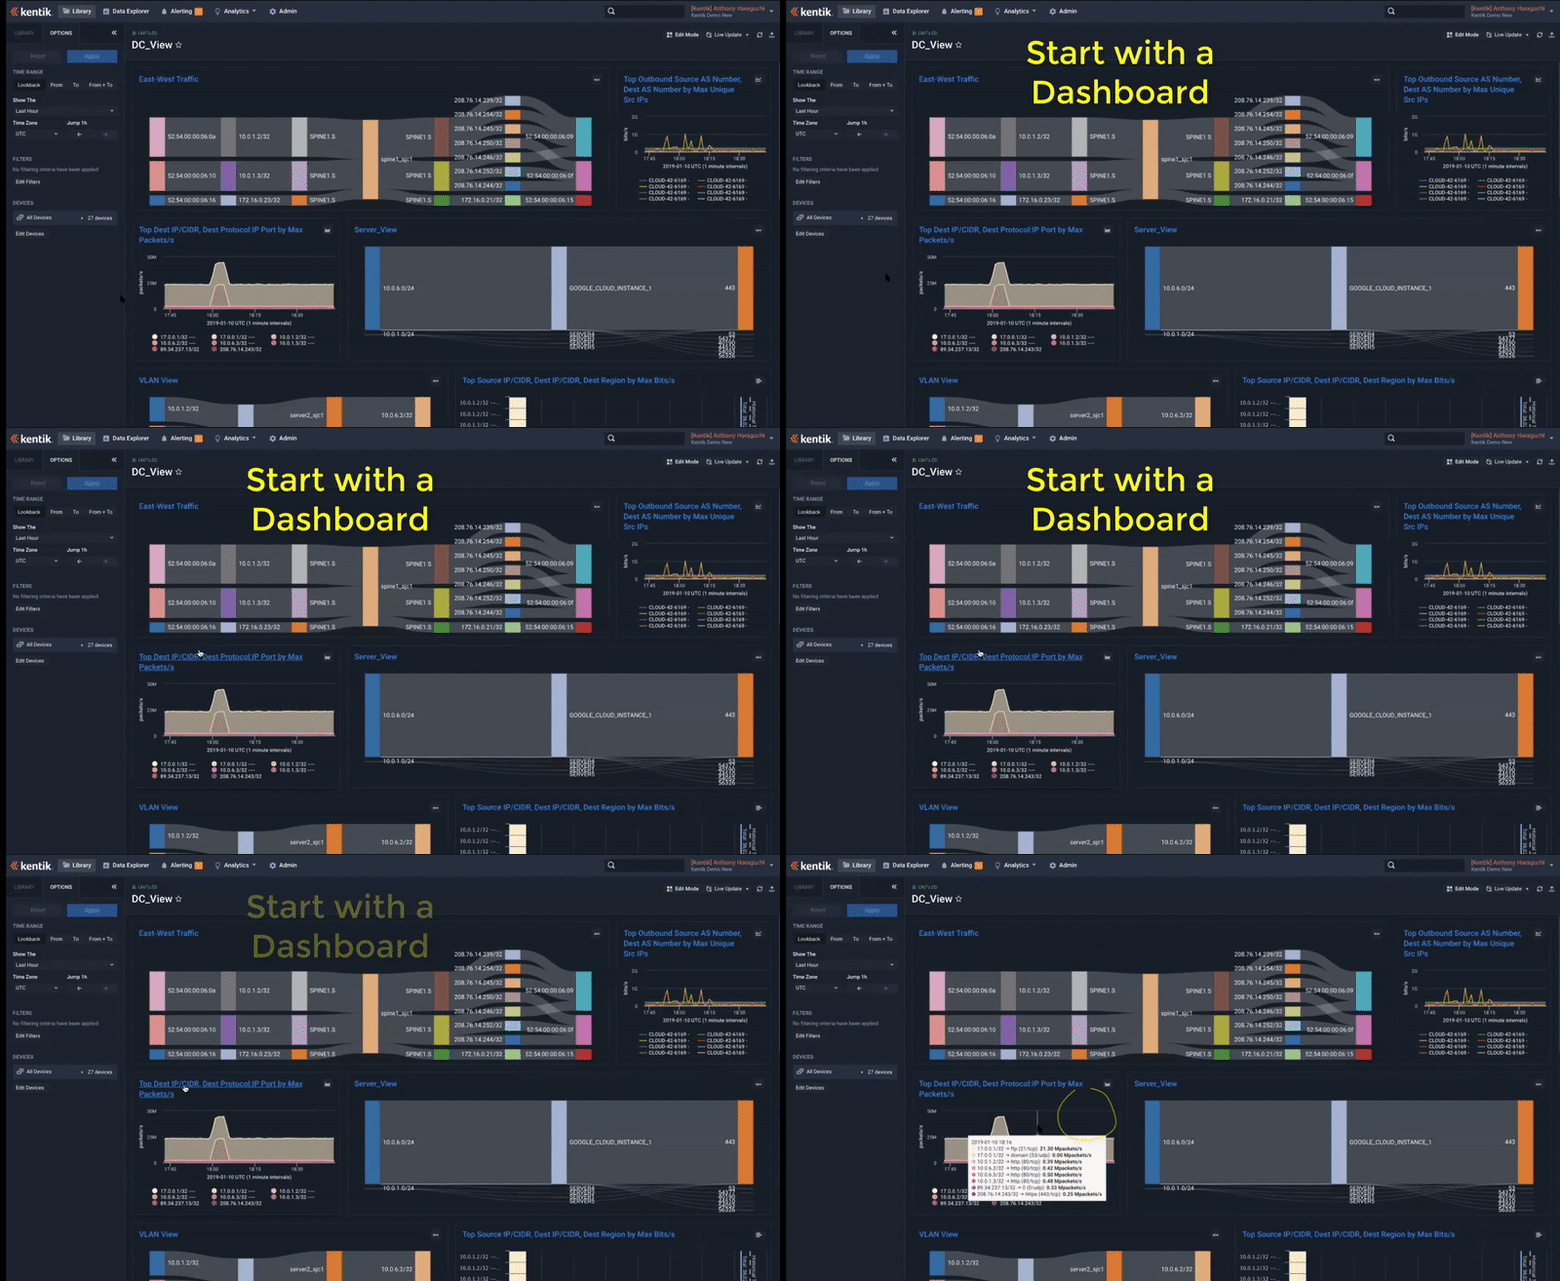
In Kentik, every alert is linked to a pre-built dashboard that’s customized for the policy that generated the alert. These dashboards include all the relevant charts and graphs to ensure an efficient troubleshooting process. Think about how much time is saved by having all the data you need pre-assembled in one place, rather than manually pulling it from siloed sources. Kentik dashboards are your starting point to quickly browse through and get a sense of the overall health status of your network, see the big picture, and spot any potential problems.
2. Data Explorer takes you farther
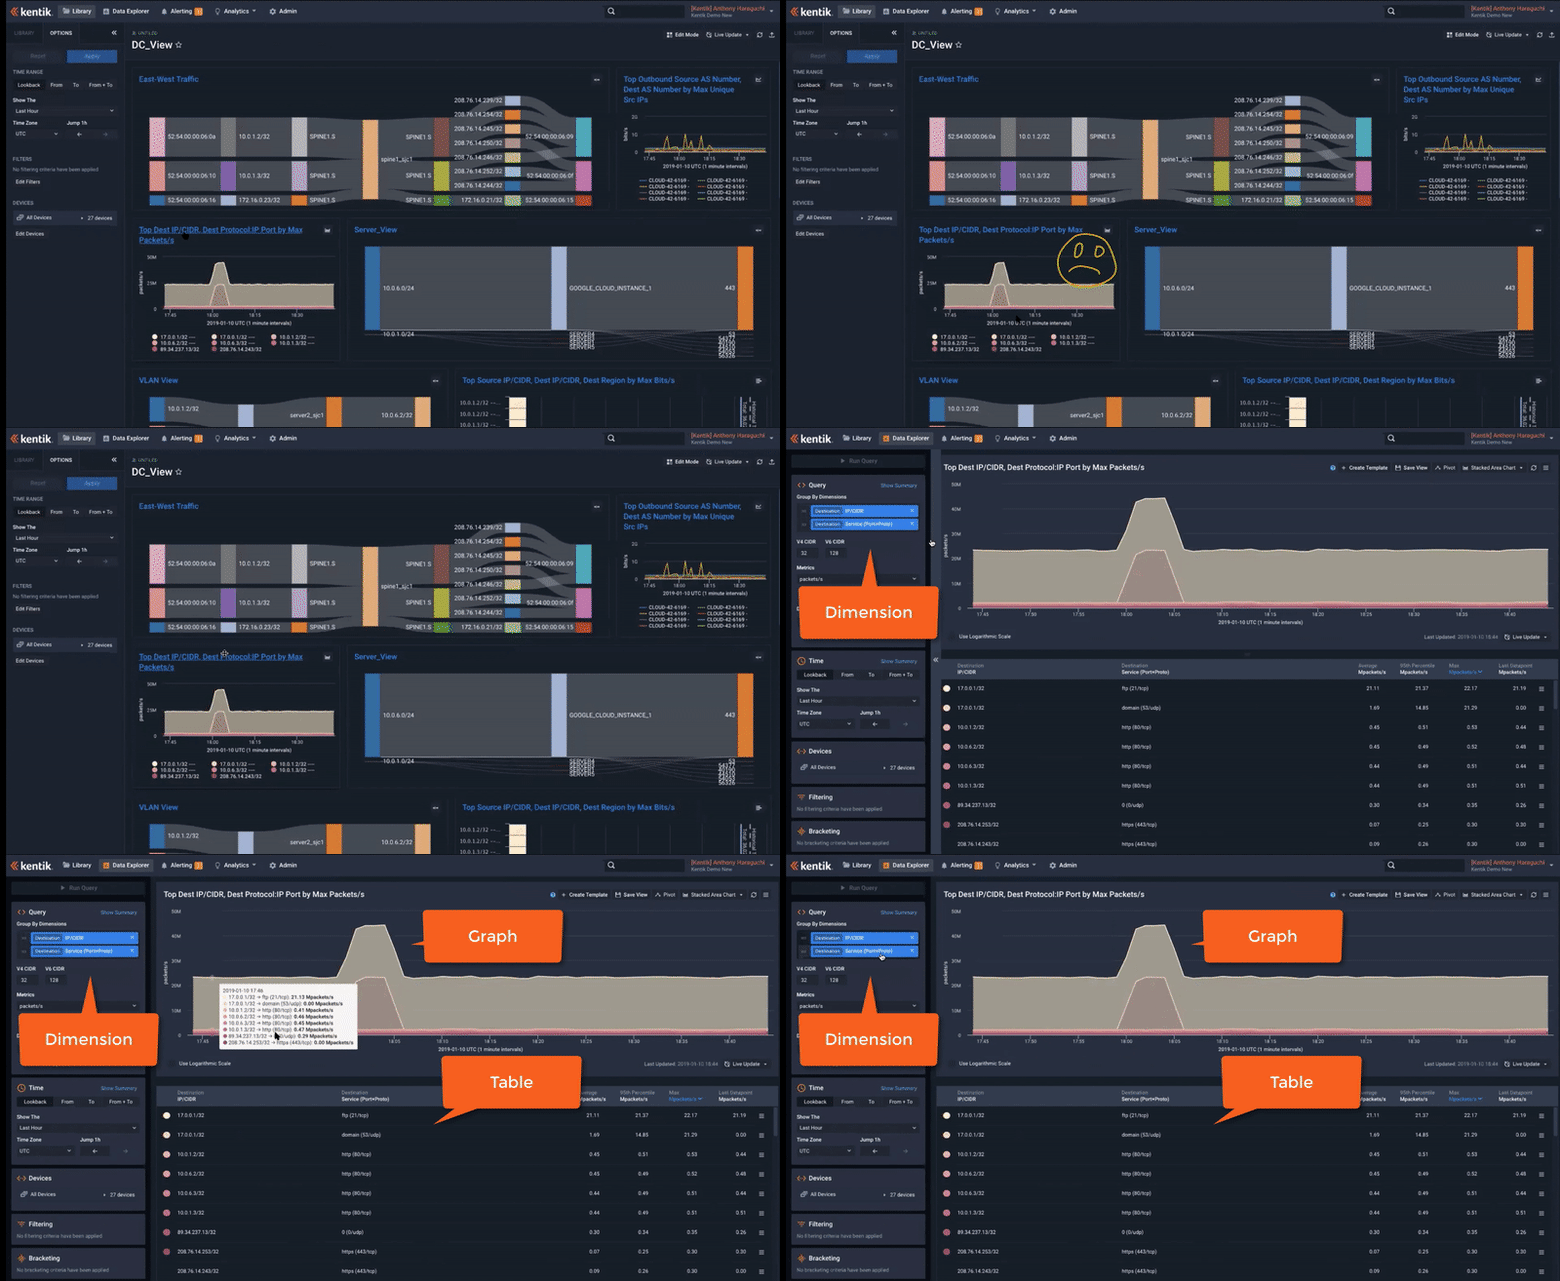
Troubleshooting networks with tools of the past is like cutting a four-foot sheet of plywood with a hand saw. By the time you’re done, you’re exhausted and swearing. Kentik’s Data Explorer is like a powerful table saw, slicing through network problems in seconds. Once you locate a spike on a dashboard, you can click on the graph, which takes you directly into the Data Explorer. The Data Explorer is composed of query controls on the left, and visualization with a table on the right, which show the query output. This makes it simple to run ad-hoc queries (or chains of queries) with each new result appearing in under one second.
3. Drill down
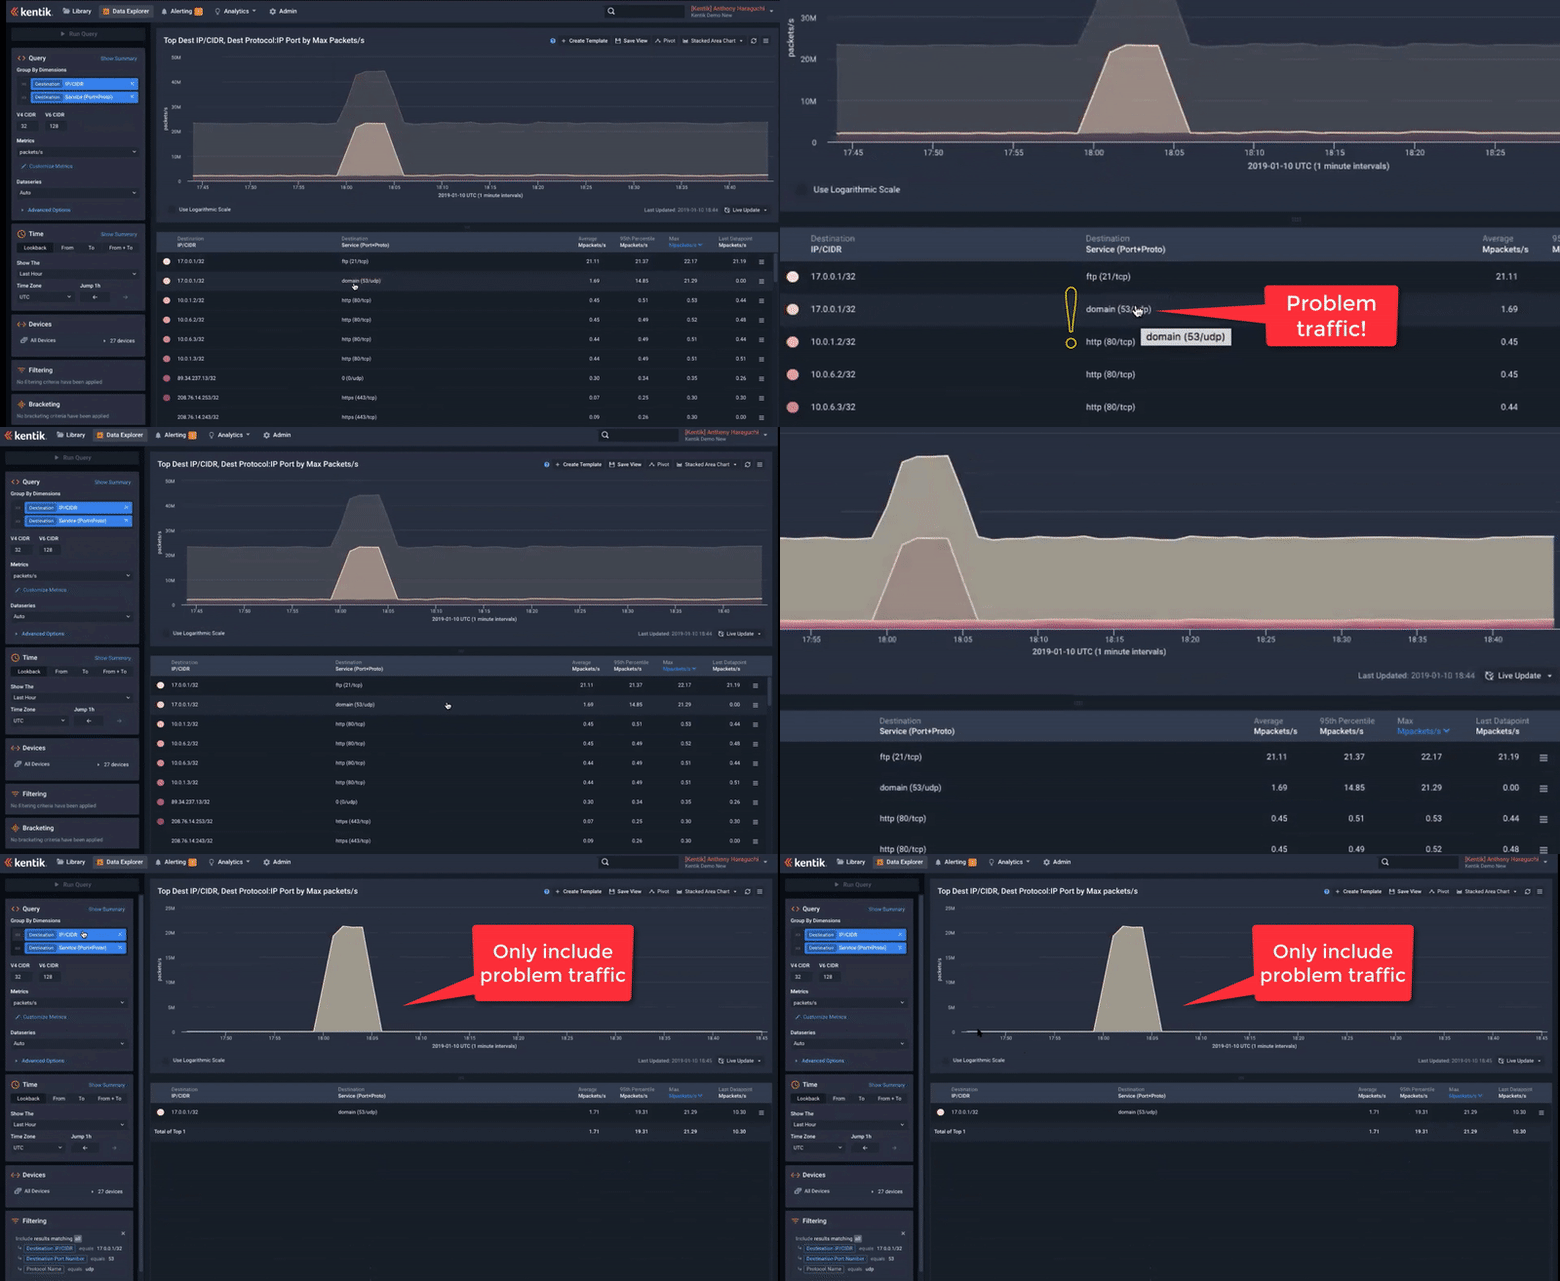
A big part of the troubleshooting process is eliminating unrelated results so that the signal can stand out from the noise, allowing you to focus only on the traffic related to the problem. “Include” and “exclude” make this process fast and easy. Here’s how: find the problem traffic as a row in the table, open the drop-down menu for that row (on the very right of the image below), click “include” (or “exclude”) and then “run query.” Now the graph and table are redrawn with only the selected traffic included (or without that traffic in the case of “exclude”). Repeating this process a few times is a super fast way to discover root causes and resolve issues.
4. Zoom in and add additional dimensions
The next step is to narrow the time range to pinpoint when the issue happened. Kentik’s time series visualizations are interactive, so this step is as simple as clicking and dragging across the narrower time range you’d like to see. When you zoom in, time series data is aggregated automatically. For example, in a “30-day” graph/chart, each data point represents one hour; in a “1-day” graph/chart, each point is 10 minutes; and in a “1-hour” graph/chart, each point is one minute. Now with the exact timeline, you may be able to correlate the spike to a possible incident/event that directly or indirectly caused it.
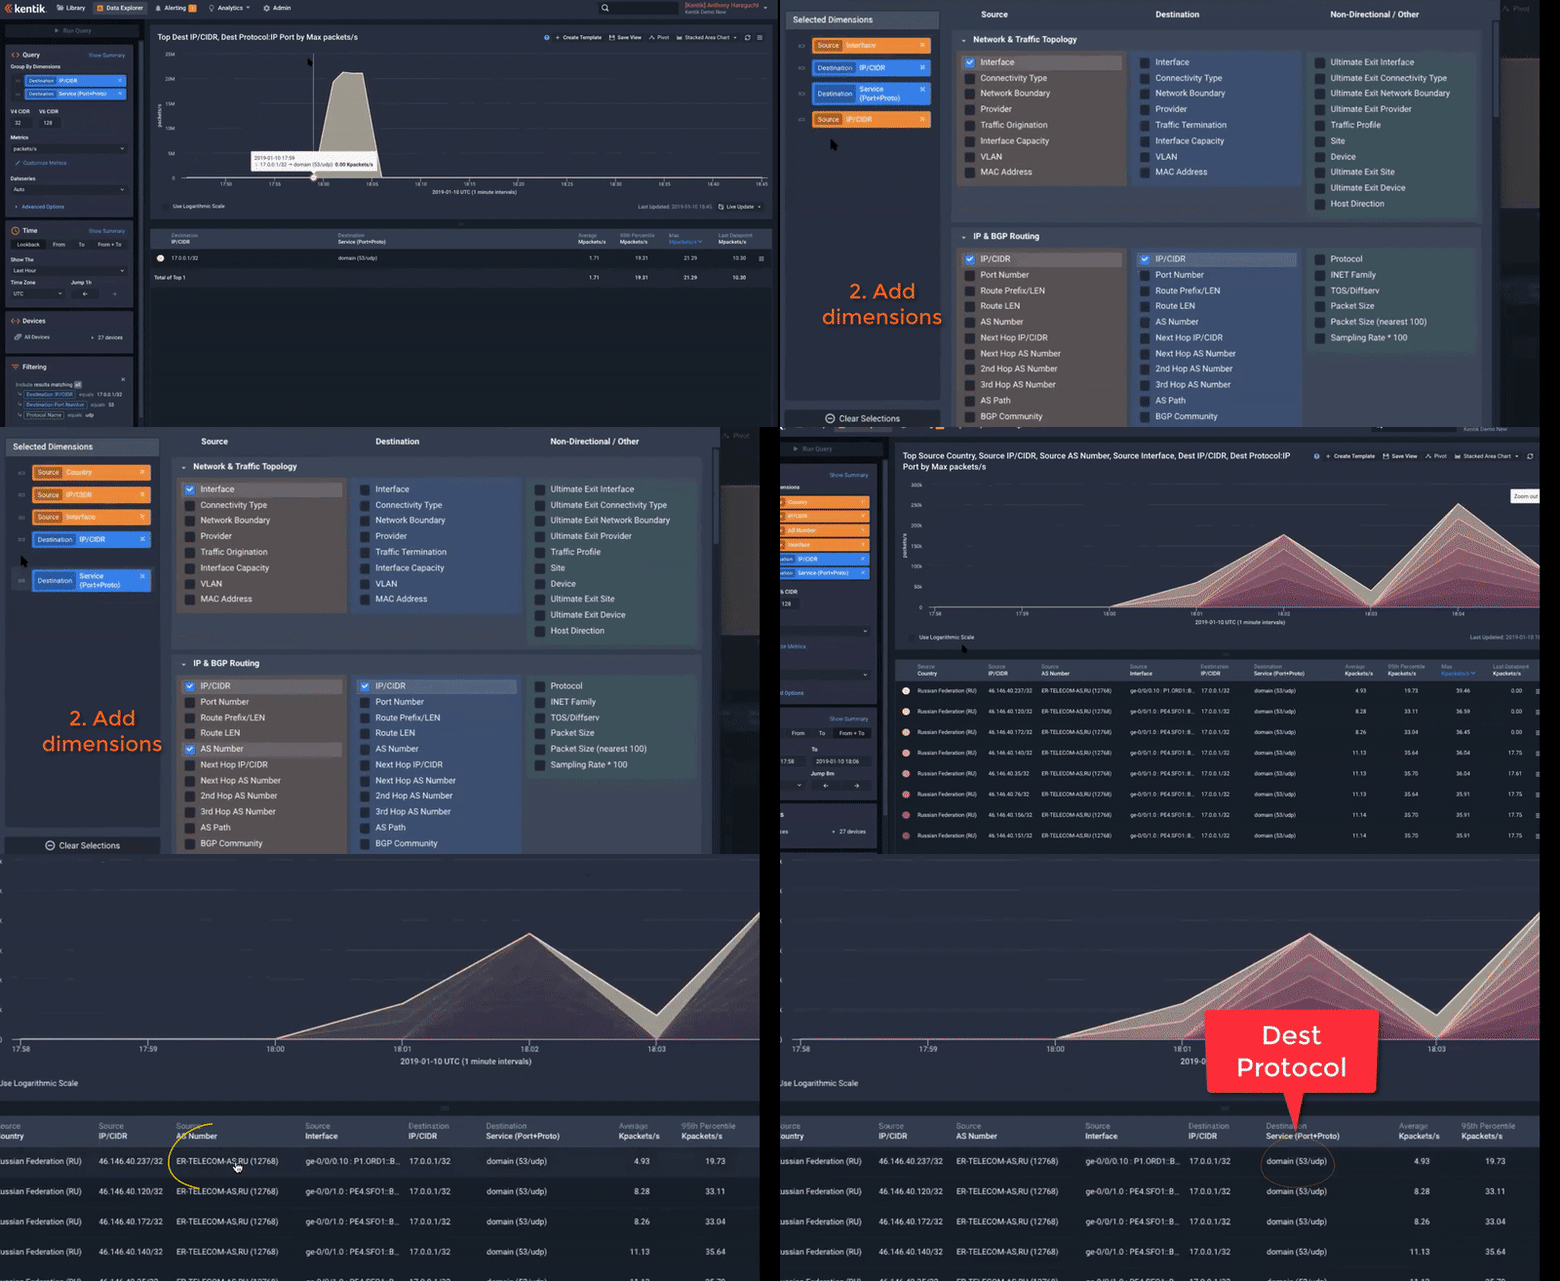
Clicking anywhere in the dimension control (top left) will take you to the dimension selector. You can add or change dimensions to pivot the data, adding additional insight to help find the root cause. Once you run the updated query, you can see where the problem traffic is sourced from, which AS it comes from, and any other information that might be useful.
5. Follow-up actions
In the four simple steps above, you’ve seen how to quickly narrow down an issue and see why it happened, where the traffic originated, and much more. However, don’t call it a day just yet. There are a few more things to do:
- Share the view with other stakeholders
- Think about the action you will take — either to mitigate the risk or prevent it from happening the next time
And Kentik can help with that too. For a complete demo, please watch the video below.
If you’d like to explore Kentik directly, you can sign up for a free trial to experience troubleshooting network issues at lightning speed.
Note: This is a demo environment.