Summary
It��’s very costly to operate a large-scale Internet edge, making lower-end edge routers a subject of keen interest for service providers and Web enterprises alike. Such routers are comparatively short on FIB capacity, but depending on the routes needed to serve your customers that might not be an issue. How can you find out for sure? In this post, Alex Henthorn-Iwane, VP Product Marketing, explains how a new feature in Kentik Detect can show you the answer.
Route Traffic Analytics Enables Lower-Cost Edge Routers

With a single name-brand edge router costing up to $1M+, operating a large-scale Internet edge can be a costly proposition. Whether you’re a Web enterprise selling goods and services online or an ISP selling connections, that cost can be a significant hurdle to launching or expanding your business. That’s why a major area of exploration these days is the use of lower-cost edge routers or even white box-based solutions. But there’s a major advantage that you give up when moving from established, high-end routers to lower cost options: routing and forwarding scalability.
High-end, brand-name routers can hold the entire Internet routing table many times over in their control plane processor memory, and their control plane software is efficient and stable enough to enable timely processing of continuous updates to the Routing Information Base (RIB, a.k.a. IP Routing Table). This capacity to scale, which illustrates the advantage of mature products, is something that brand name routers have developed over a long time. Lower-cost routers don’t have that advantage, but they are steadily catching up in terms of RIB scalability.
A much larger capacity gap exists between between high- and low-end routers with respect to the Forwarding Information Base (FIB, a.k.a. CEF table or IP forwarding table), meaning the scale of the forwarding plane hardware. In high-end routers the FIB accommodates the entire Internet RIB, over 360K CIDR-aggregated entries and roughly twice that in unaggregated prefixes. Lower-cost routers have dramatically less FIB capacity, typically on the order of 30K entries.
Can Your FIB Fit Your RIB?
Let’s suppose that your network is heavily multi-homed to the Internet, and that you are looking for ways to reduce CapEx on your edge routers. The key question is whether you can handle traffic for the vast majority of your customers with 30K FIB entries. If you can manage to send most of your important traffic within that constraint you can then use a default route to handle your remaining traffic flows.
To arrive at a practical answer to that high-level question, network managers need to answer two more detailed questions. First, what’s the correlation of traffic flows to routed prefixes? And second, how much and how often does that correlation change? The latter question is important because even if you can calculate route traffic density, if the correlations change too rapidly and dramatically, it might not be feasible to utilize route traffic density data to configure the FIBs in lower-cost routers. Fortunately, Kentik Detect’s fast, deep analytical visibility into traffic flows can help answer those questions.
Our recent Kentik hackathon included a project by some of our engineers showing how Kentik Detect could be used to provide an analysis by tranches of routes, thereby showing how much traffic (by percent) is being handled by how many prefixes. An analysis of this type addresses the real need discussed above to assess the feasibility of utilizing lower-cost routers. And it also provides practical insight into which prefixes to include in a lower-cost router’s FIB. The engineers who worked on the hackathon project utilized traffic flow and routing data from a number of networks that were interested in the results.
Yes! (Most Likely)

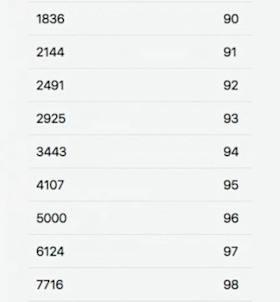
The finding of the hackathon project was that in many large networks, it is indeed possible to handle the vast majority of traffic flows in a FIB whose capacity is limited to 30k BGP routes. The following table, based on data from a large, multi-homed network and condensed for brevity, shows the correlation between the number of routes and the percentage of traffic flows associated with those routes. The number of routes is shown in the left column, while the right column shows the percentage of overall traffic volume covered by those routes. As you can see, in this network it is possible to serve 98% of all traffic flows with only 7716 routes, far below the 30K threshold set for the project.
The hackathon project showed that it’s relatively easy to derive route traffic density using the capabilities of Kentik’s big data network traffic intelligence platform. For the hackathon the use case of the route assessment was in the realm of business intelligence. But given the level of detail Kentik Detect makes available, a dataset of this type could also be used in a production scenario as the input to operational automation that pushes prioritized routes into the FIBs of lower-capacity routers.
Further analysis of the results showed that in the networks surveyed there was little change over time in the percentage of traffic associated with the top prefixes. That indicates that even pushing a top N list of prefixes into the FIB on a daily basis may be good enough to keep traffic flowing optimally within the capacity constraints.
Aside from the interesting data gathered from customer networks, this project also demonstrated the power and flexibility of Kentik Detect to deliver highly valuable analytics that straddle the difficult line between operational details and business intelligence. Which leads me to…
Route Traffic Analytics in the Kentik Portal!
I originally wrote this blog post with a placeholder statement that we’d be developing this feature at some point in the future. But before we could publish the post, our engineering team beat me to the punch by turning the hackathon project into a new feature — Route Traffic Analytics — that is already live in the Kentik portal (reached via the Analytics menu).
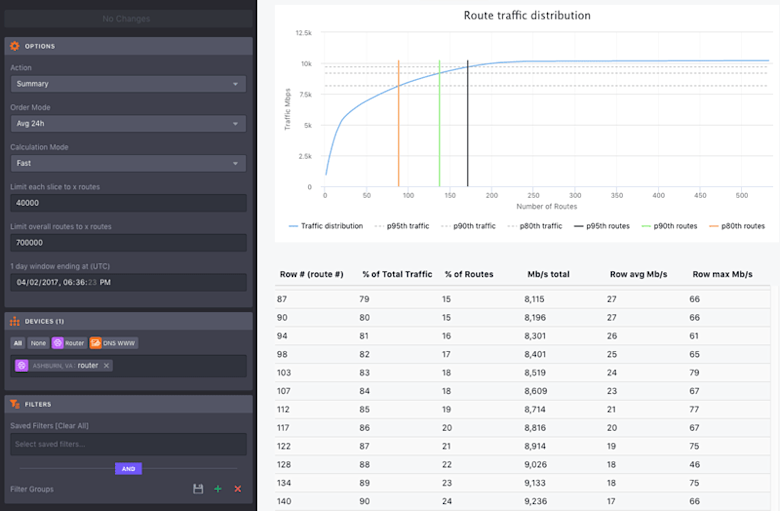
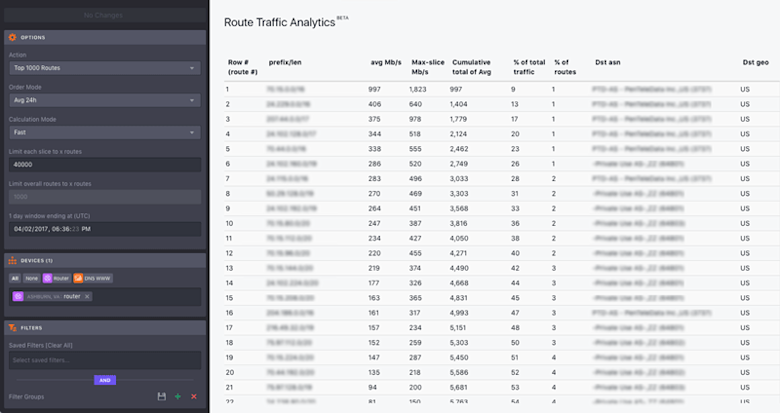
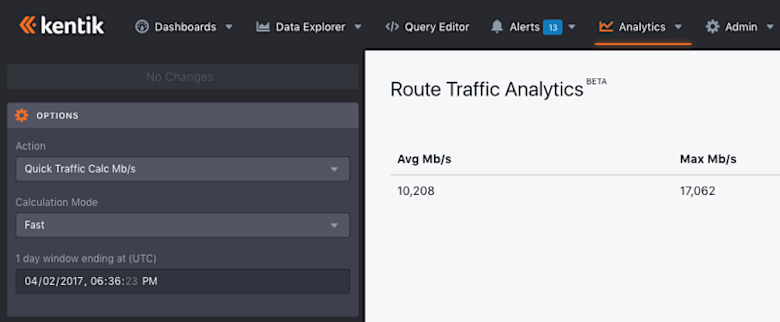
Route Traffic Analytics is configured in the sidebar, where you choose the devices to include, filter traffic by any of dozens of dimensions, and choose options from a variety of settings (order, data-series resolution, slice sizing, time range) that help ensure that you see the data that’s of greatest utility. The Actions setting includes a number of analyses that yield practical outputs showing the correlation of routing and traffic flows:
- Correlate flows to routes: The Summary analysis provides insight into the number and percentage of traffic flows correlated to the number and percentage of routes, plus Mbps per analyzed tranche of routes. This insight is helpful to understand the capacity needed in edge router FIBs to handle the desired percentage of traffic flows.

- Show top 1000 routes: A listing of the top 1000 routes by traffic density, which provides more details per route.

- Show volume overview: A quick calculation of average and max Mbps per route.

- Export CSV for top routes: Exports top routes to CSV, which can be used to configure routers.
Route Traffic Analytics is just one example of the kind of network insights that Kentik Detect can provide to help you reduce costs without sacrificing service reliability or performance. If this sounds like the level of network visibility you need, schedule a demo. Or dive in directly right now by starting a free trial. In just 15 minutes you could be signed up and analyzing real traffic data on our powerful, secure, multi-tenant SaaS.
