Gathering, Understanding, and Using Traffic Telemetry for Network Observability


Summary
Traffic telemetry is the foundation of network observability. Learn from Phil Gervasi on how to gather, analyze, and understand the data that is key to your organization’s success.
Traffic telemetry is the data collected from network devices and used for analysis. With traffic telemetry, engineers can gain real-time visibility into traffic patterns, correlate events, and make predictions of future traffic patterns. As a critical input to a network observability platform, this data can help monitor and optimize network performance, troubleshoot issues, and detect security threats.
However, traffic telemetry can be difficult to understand. While some enterprises might gather the data, many don’t know what to do with it—or they don’t have the tools to make the most of it.
In this article, we’ll look at:
- How to effectively gather traffic telemetry
- Tools for analyzing and understanding the collected data
- How to leverage traffic telemetry for network observability
Let’s start by looking at data collection.
How to gather traffic telemetry
Gathering traffic telemetry involves monitoring and collecting data on the flow of network traffic. This can be done through a variety of techniques, such as using network taps, port mirroring, or software probes.
Network taps
One common method of gathering traffic telemetry is by using a network tap. A network tap is a hardware device that enables the passive monitoring of network traffic by copying all data passing through a network connection. This data can then be analyzed and used to monitor network performance, detect issues, and troubleshoot problems.
Port mirroring
Another method for gathering traffic telemetry is port mirroring, which replicates (mirrors) the network traffic on a switch or router to a monitoring device. With port mirroring, an engineer can monitor the traffic on specific ports or VLANs, which is especially useful for identifying issues with specific devices or applications.
Software probes
Software probes are programs that can be installed on servers or network devices to collect data on network traffic. They can provide detailed information on traffic patterns and usage. Envoy is a popular network proxy used by many service meshes that can also operate as a software probe.
Many cloud providers already have capabilities in place for collecting traffic telemetry. Azure has the Azure Network Watcher, AWS has CloudWatch, and GCP has Cloud Monitoring.
Monitoring network traffic can be expensive. It’s easy to fall into the trap of capturing every bit that goes through your network, then storing it forever. This may give you perfect knowledge, but unless this amount of information is required for compliance and regulatory reasons, this approach is undoubtedly overkill. You should think carefully about how much traffic telemetry you collect, balancing the value you derive from the data against the cost of capturing and storing it.
Tools for analyzing and understanding traffic telemetry
The raw data of traffic telemetry is too massive and low-level to understand directly and utilize. You’ll need to process this data, normalizing and aggregating it. Then, you’ll correlate it with other data sources. Finally, you can start the analysis after storing the processed data to identify trends and patterns.
Popular open-source projects for storage and visualization of traffic telemetry data (and other types of data) include:
- Prometheus and Grafana: This is a powerful combination of the Prometheus time series database (that focuses on metrics collection) and the Grafana dashboarding-and-alerting platform.
- Elasticsearch and Kibana: Geared primarily towards log data, this combination is often used along with Logstash or Fluentd to form the ELK (Elasticsearch + Logstash + Kibana) or EFK (Elasticsearch + Fluentd + Kibana) stacks.
Kentik has several open-source projects in the area of network observability. Check out Kentik Labs for more information.
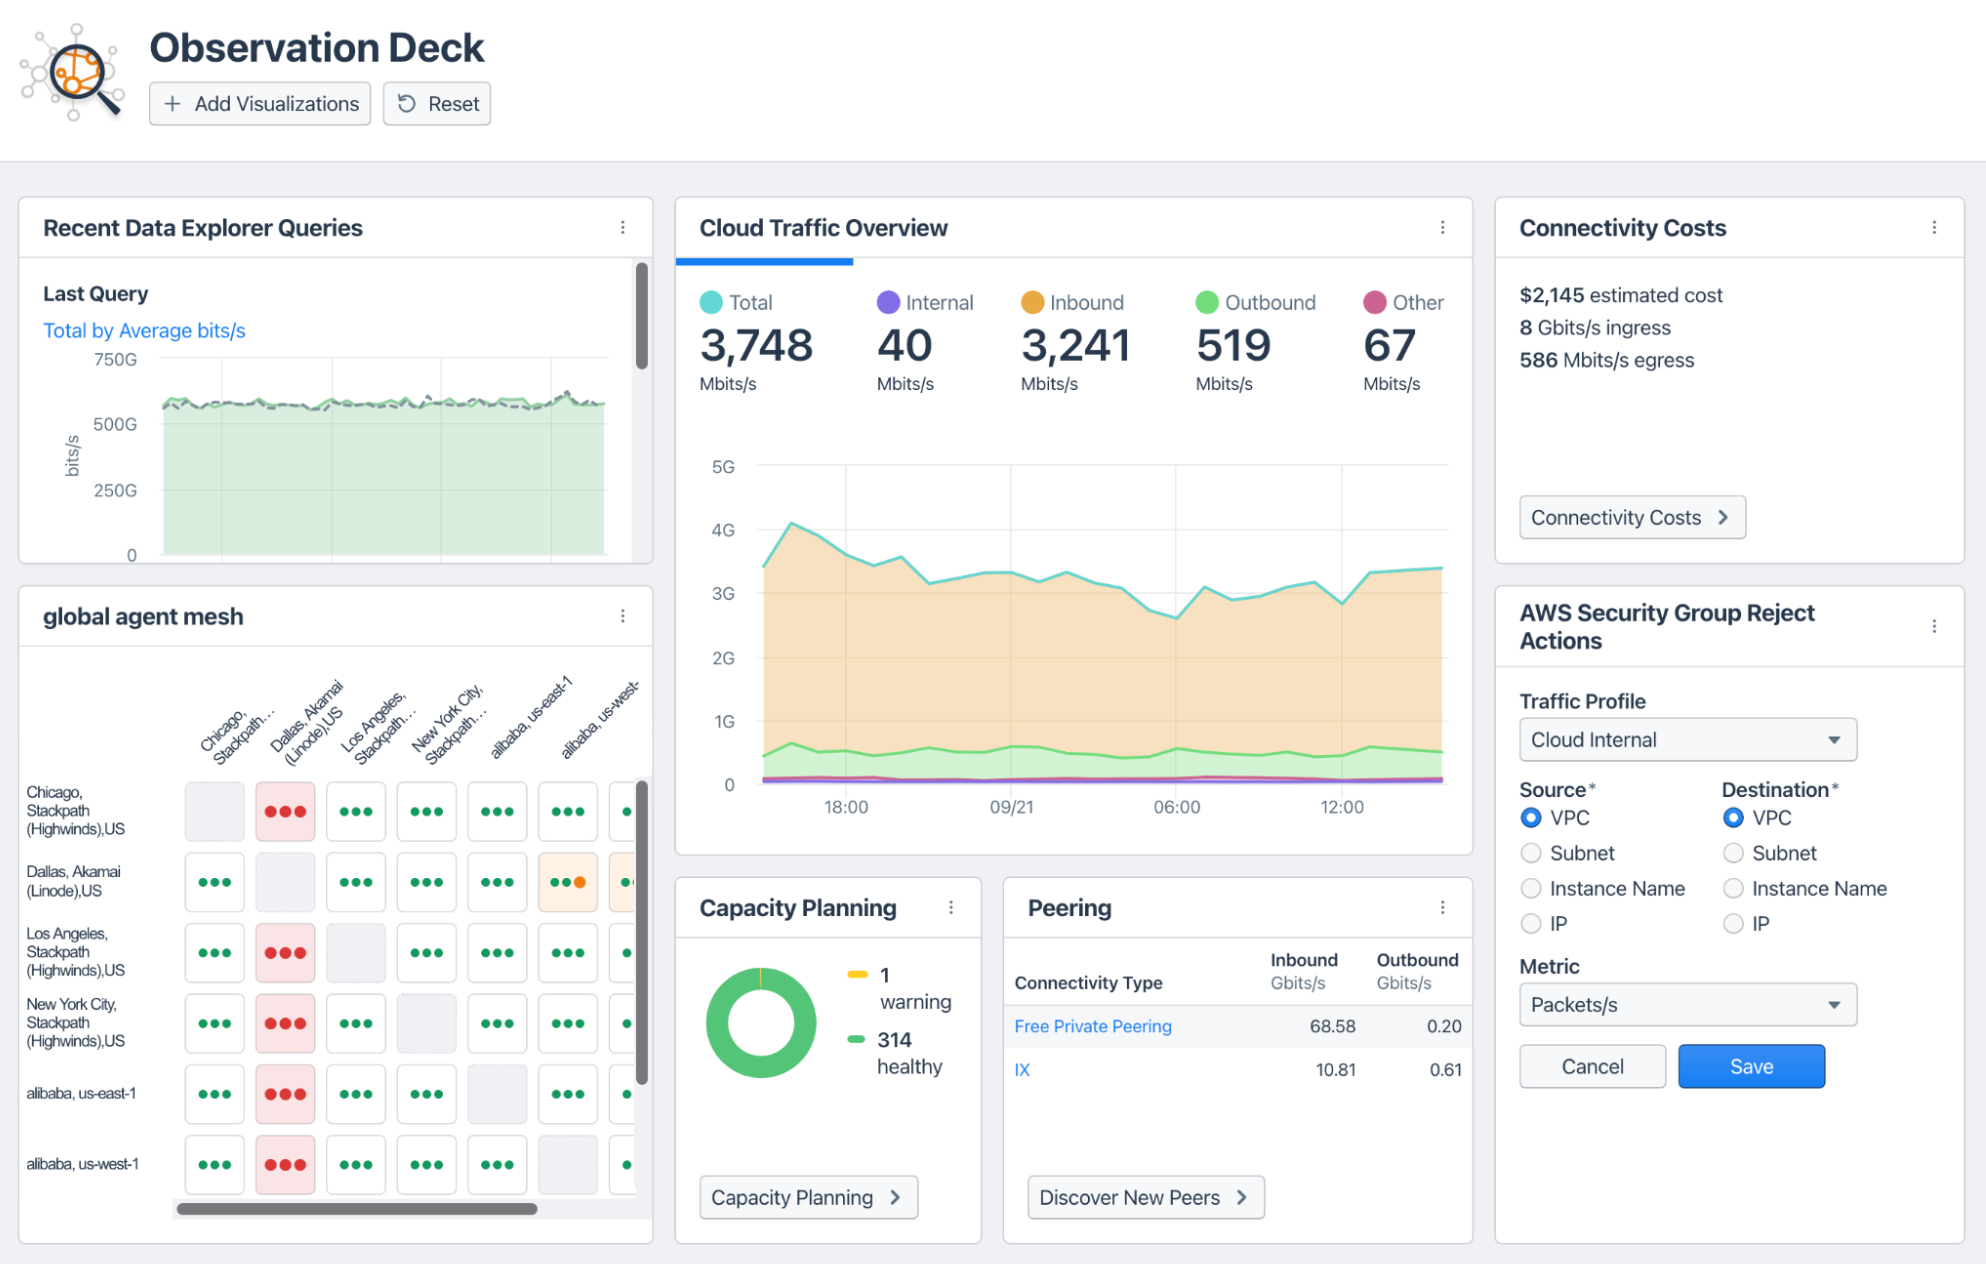
In the commercial space, Kentik’s network observability platform offers a streamlined, turnkey solution that can integrate with your existing infrastructure and open-source observability solutions.
How to leverage traffic telemetry for network observability
Gathering and analyzing data might be fun, but at the end of the day, the goal is to leverage your data and gain value from it. Let’s consider simple use cases for leveraging traffic telemetry to troubleshoot network issues and improve performance.
Identifying bottlenecks
You can identify bottlenecks by looking for high utilization on specific network segments, large numbers of dropped packets, or retransmissions.
Detecting malware and DDoS attacks
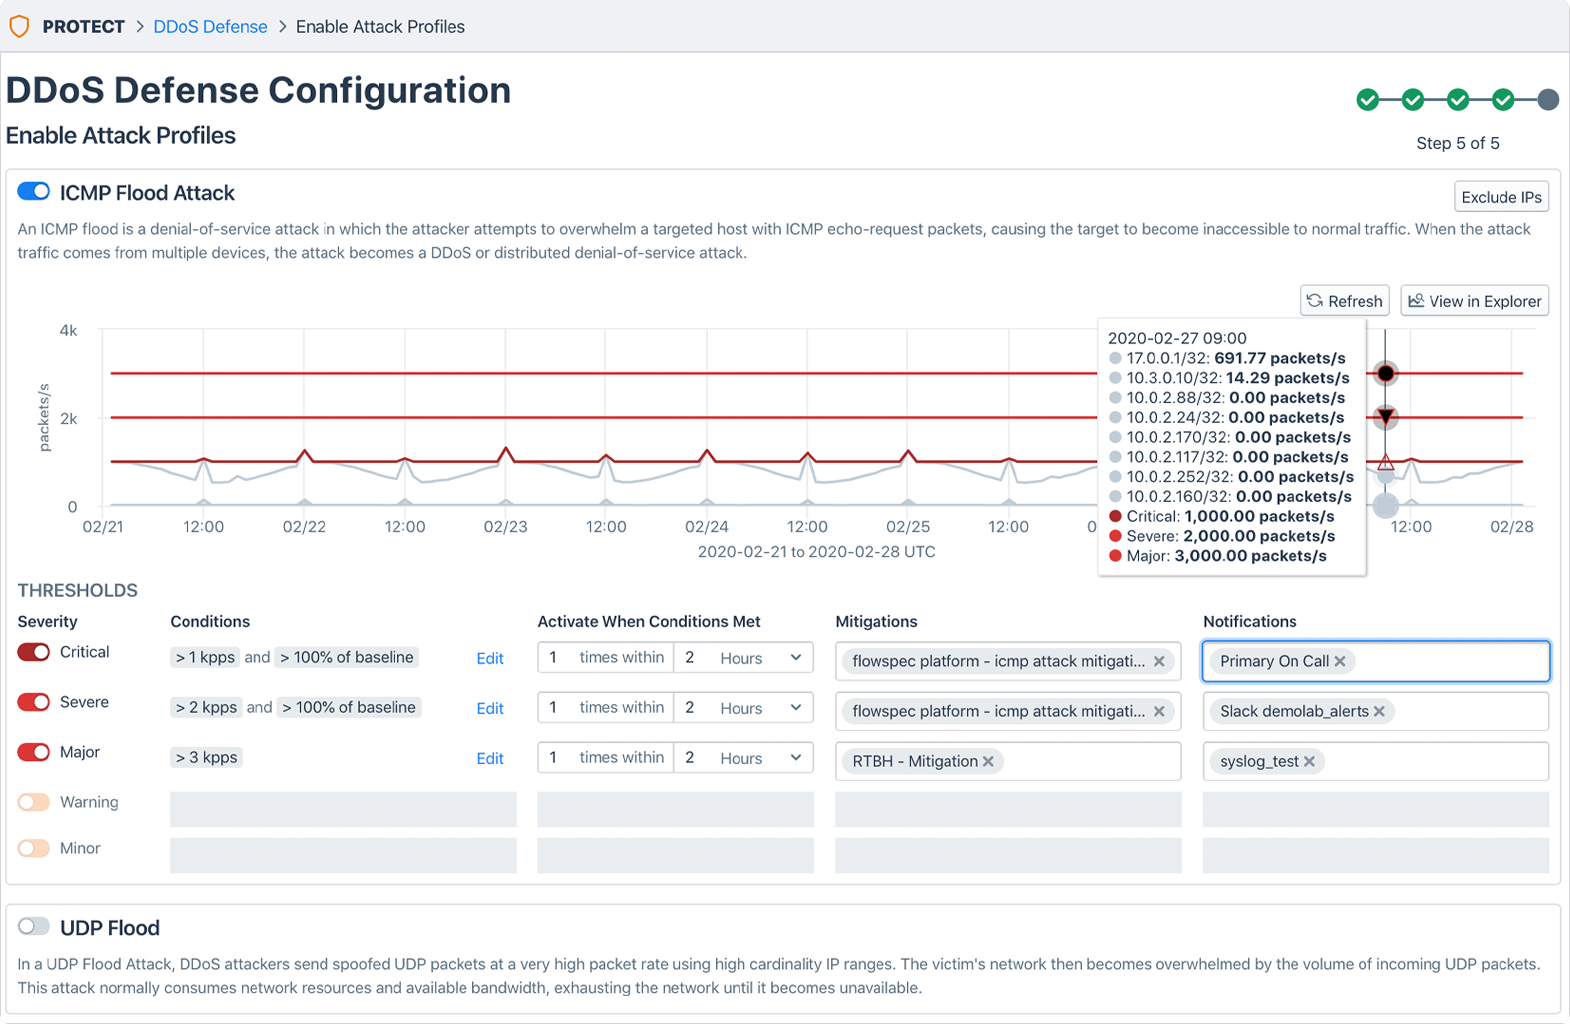
You can detect malware and DDoS attacks by looking for unusual traffic volumes, unexpected traffic destinations or sources, or abnormal protocol usage. Correlate the data with other information, such as firewall logs, threat intelligence feeds, and endpoint security data.

Capacity planning
Traffic telemetry can assist you with capacity planning as you look for daily and weekly traffic patterns, seasonal variations, and traffic spikes. With these insights in hand, you can use statistical techniques such as trend analysis, time series analysis, or forecasting algorithms to predict future traffic patterns. The forecast will allow you to determine future resource needs.
Identifying devices using a lot of network resources
Look for patterns such as high utilization on specific network segments, large numbers of packets sent or received, or high numbers of retransmissions. Then, correlate that data with information such as IP addresses, MAC addresses, and device names. In doing so, you’ll identify specific devices that are using a lot of network resources.

As you take concrete action on your traffic telemetry, consider these best practices:
- Regularly review network configurations to identify and correct misconfigurations.
- Regularly update and patch servers and devices for security and performance.
- Identify and isolate malicious traffic and attackers.
- Detect and alert on non-encrypted traffic.
- Implement continuous monitoring over time.
Conclusion
Traffic telemetry is the foundation of your network observability, providing several benefits that include improved visibility, faster troubleshooting, network optimization, better security, tighter compliance, and response automation. However, putting in place a full-fledged network observability solution is not for the faint of heart. You’ll need good tools and a robust network observability platform. To learn more about Kentik, sign up for a demo.


