HBO Attack: Can Alerting Help Protect Data?

Summary
Major cyber-security incidents keep on coming, the latest being the theft from HBO of 1.5 terabytes of private data. We often frame Kentik Detect’s advanced anomaly detection and alerting system in terms of defense against DDoS attacks, but large-scale transfer of data from private servers to unfamiliar destinations also creates anomalous traffic. In this post we look at several ways to configure our alerting system to see breaches like the attack on HBO.
Setting Kentik Detect to Alert on Unauthorized Data Transfer
Last week we saw the latest in a series of major cyber-security incidents, this time an attack against HBO that caused the leak of 1.5 terabytes of private data. Here at Kentik, there’s been a lot of talk around the (virtual) water cooler about how the Kentik platform, specifically our alerting system, might have helped HBO realize that they had a breach. We’ve been planning a deeper dive into a specific use case since our last post on alerting, so I thought this incident could serve as the basis for a few informative examples of what our alerting system can do.
To be clear, the following are hypotheticals that we’re exploring here solely for the purpose of illustration. Each of the following scenarios involves creating an alert policy based on an assumption about how a massive data theft like the HBO case would manifest itself in the network data that is collected and evaluated by the Kentik alerting system. The example policies are not mutually exclusive and could be used in combination to increase the chance of being notified of such an event. In each case we begin on the Alert Policy Settings page of the Kentik portal: choose Alerts » Alerting from the main navbar, then go to the Alert Policies tab and click the Create Alert Policy button at upper right.
Top 25 Interfaces
There haven’t been a lot of technical details released on the attack itself, but we can assume that if we were HBO we would keep private data on a server that is separate from the servers from which they stream HBO Go and HBO Now. Given that, for our first example we can build an alert that looks for a change in the source interfaces that are sending traffic out of our network. 
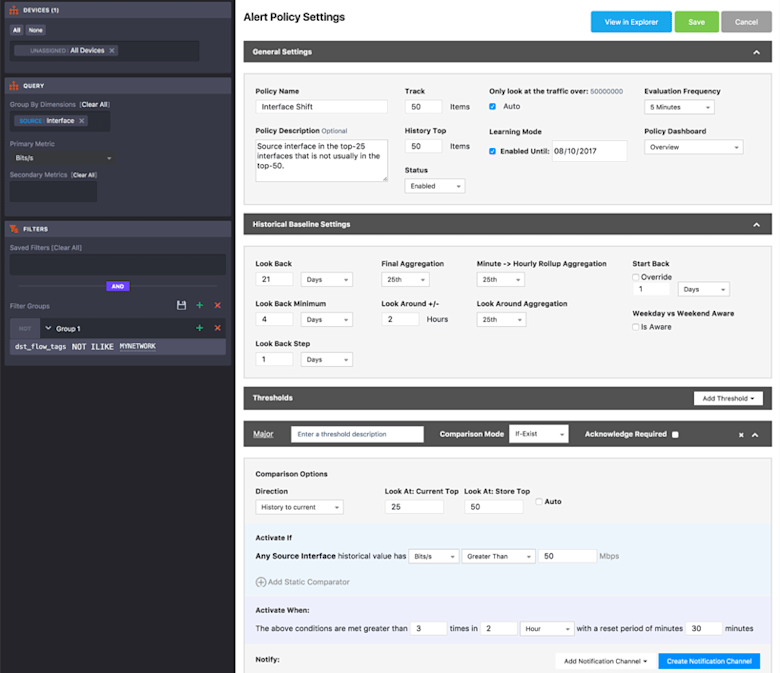
To build our policy we begin with the Devices pane in the sidebar at the left of the Policy Settings page, which we set to look at data across all of our devices. This could be narrowed down if we are looking at specific switches that would source highly sensitive data.
In the Query pane, also in the sidebar, we set the group-by dimension that the policy will monitor to Source Interfaces, and we set the primary metric to Bits/s. This means that the top-X evaluation made by the alerting system will involve looking at all unique source interfaces to determine which have the highest traffic volume as measured in Mbps. Also in the sidebar, we’ll use the Filters pane to apply a filter on the MYNETWORK tag, which will excludes traffic destined within our own network. That way we will only capture traffic that is leaving the network.
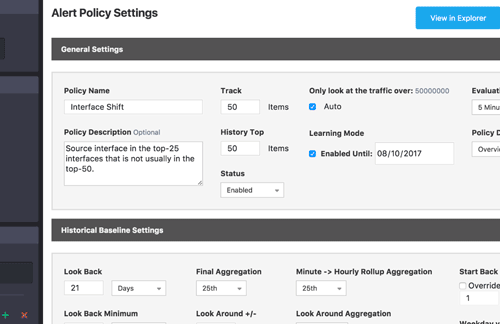
Next we’ll move to the General Setting section of the Policy Settings page. We set the Track field to track current traffic for 50 items (source interfaces, as we set in the Query pane), and the History Top field to keep a baseline history of 50 items. We’ll also set the policy to automatically determine (based on an internal algorithm) the minimum amount of traffic that a source interface will need in order to be included in our Top 50 list.
Moving on to Historical Baseline Settings, we configure the settings to look back over the last 21 days in 1 day increments (steps). Since we are evaluating every 5 minutes, we need to decide how we will aggregate this data in hourly rollups as well as our Final Aggregation for the 21 days of baseline. We set both of these settings to use 25th percentile. With the Look Around setting, we broaden the time slice used for Final Aggregation to 2 hours instead of a single 1-hour roll-up.
Finally, we configure the threshold, which is a set of conditions that must be reached in order for the alert to actually trigger. In this case, we use an “if-exist” comparison to compare our current evaluation of the top 25 source interfaces to the historical baseline group of 50 source interfaces with the most traffic. The activate if setting makes it so that the threshold will only be evaluated for interfaces with greater than 50 Mbps of traffic.
With the settings above, we’ve created an alert policy that is continually keeping track of the top 50 source interfaces that are sending traffic out of the network. If any of the the top 25 interfaces in the current sample are not in the top 50 historically, the threshold will trigger, sending us a notification (we covered Notification Channels in the previous blog, so we haven’t gone into detail here on how to set that up). If 1.5 terabits of traffic left the network from an interface that normally had fairly low volume, this policy would definitely fire off a notification.
Top 15 Destination IP Addresses

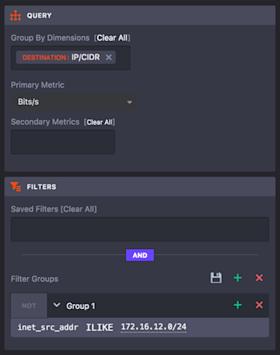
This alert policy is similar to the previous one but it monitors the top 35 destination IP addresses and creates an alert if the current Top 15 are not in the Top 30 historically. To make this policy work, we start back at the sidebar. In the Query pane we set the group-by dimension to destination IP/CIDR. And in the Filter pane we narrow the data that we are evaluating by setting a filter for the source subnet that the private server is part of.
We also change Historical Baseline settings so that the policy uses 98th percentile aggregation for the Minute -> Hourly Rollup and 90th percentile for the Final Aggregation. Lastly we’ll change the comparison options settings so that the current group is top 15 and the baseline group is top 30. If breached data were transferred from the private subnet to a new IP on the Internet then this threshold would be triggered and we would receive notification.
Top 10 Countries
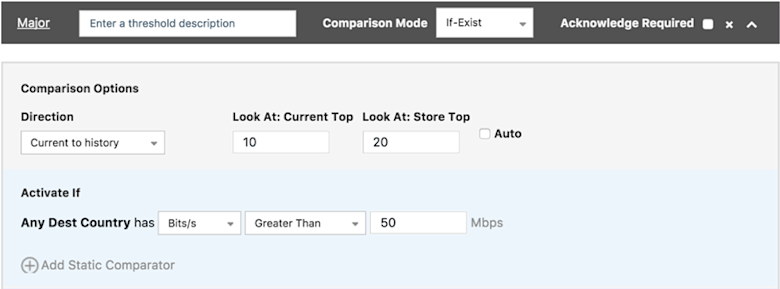
Another alert policy variation we could use is to look at destination country. This approach would be based on the assumption that the country this attack came from is not one that normally sees a lot of traffic from this private server. In the Query pane we’ll change the group-by dimension to destination country, but we’ll keep the Filter pane as-is to look at the source subnet for the private server. In General Settings, meanwhile, we’ll set both Track and History Top to 20.

Configured this way, the alert policy is monitoring the Top 20 countries and the threshold will be triggered if any of the Top 10 in the current sample is not in the Top 20 historically. If we see a large volume of traffic leaving our server headed to a country to which we don’t normally send traffic, we’ll get a notification.
Summary
It’s always easier to see the take-aways of a situation when you have the benefit of being a Monday Morning Quarterback. But what these examples show is that with the powerful capabilities of Kentik’s alerting system you can monitor your network for changes in traffic patterns and be notified of traffic anomalies that might just indicate the kind of data grab suffered by HBO.
If you’re already a Kentik Detect user, contact Kentik support for more information — our Customer Success team is here to help — or head on over to our Knowledge Base for more details on alert policy configuration. If you’re not yet a user and you’d like to experience first hand what Kentik Detect has to offer, request a demo or start a free trial today.
