How to Configure Kentik NMS to Collect Custom SNMP Metrics

Summary
Out of the gate, NMS collects an impressive array of metrics and telemetry. But there will always be bits that need to be added. This brings me to the topic of today’s blog post: How to configure NMS to collect a custom SNMP metric.
The recent release of Kentik NMS has impressed and excited a lot of folks, as evidenced by the volume of current Kentik customers kicking the tires of our newest capability, as well as folks who hadn’t dipped their toes in the warm and welcoming waters of Kentik’s platform until they heard about NMS.
Out of the gate, NMS collects an impressive array of metrics and telemetry. But that doesn’t mean it knows about absolutely everything. No matter how diligently Kentik’s engineers work to incorporate devices and data points (both new and old), there will always be bits that need to be added.
Not only is it impossible for any monitoring and observability solution to know about every possible data point, but making a tool collect “every” metric would cause it to be unreasonably slow.
The goal, instead, is to collect all the telemetry commonly needed and provide the ability to extend the tool to collect other metrics specific to each company’s circumstances.
This brings me to the topic of today’s blog post: How to configure NMS to collect a custom SNMP metric.
Everything was going great until…
Imagine sitting at your desk, monitoring your little heart out with Kentik NMS. Even the Raspberry Pi boxes you’re using for small but essential tasks are showing up. Things are looking great.

Until you realize two things in quick succession:
- Those Raspberry Pi’s are warm enough to heat up a slice of… well, actual raspberry pie.
- Temperature stats aren’t showing up.
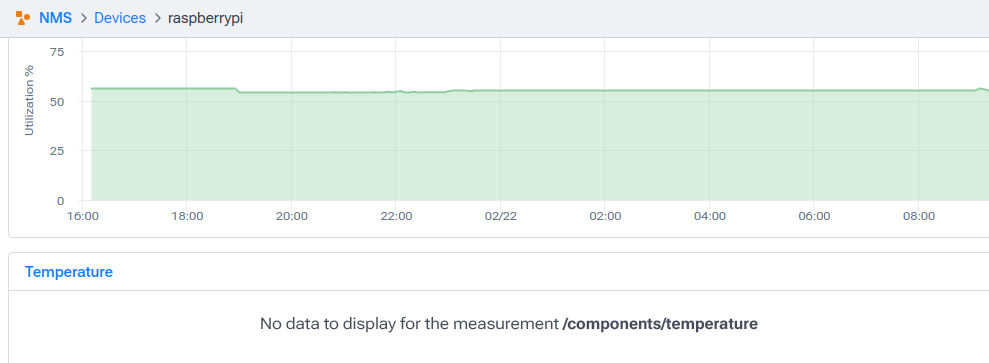
To be clear, I’m using temperature as a simple but common example. It could just as easily be toner status on a printer or a list of services running on a server, complete with CPU, RAM, and IO utilization for each service. What I’m about to explain is how to include any new SNMP metric, irrespective of data type or vendor.
With those clarifications out of the way, let’s add some temperature stats to our view to see whether we should stock up on fire extinguishers.
Is it time to migrate to a modern network monitoring system?
Preparing for success
Before we start making changes, I want to go over the information you need at your fingertips.
First and foremost, you need to have the SNMP objects (OIDs) that get the data you want, and you should be certain the device responds to those objects in the way you expect.
In my case, the OID I want is: 1.3.6.1.4.1.2021.13.16.2.1.3.1
There are lots of sources for OID information; one such source is https://oidref.com.
To validate that my device responds correctly, I can use the SNMPWalk utility to poll just that value:

Now that we have our OID and we’ve confirmed it works on the device in question, our last step is to ensure we understand how this value is formatted. In this case, it’s in “milli-Celsius,” so 39166 is actually 39.1 degrees Celsius (or 102.38 degrees Fahrenheit).
Finally, I have to understand the SNMP system object (sysobjectid) of the device to which I want to add my data. You can find that by going into Kentik’s portal, visiting the Devices page, and adding the SysObjectID column.
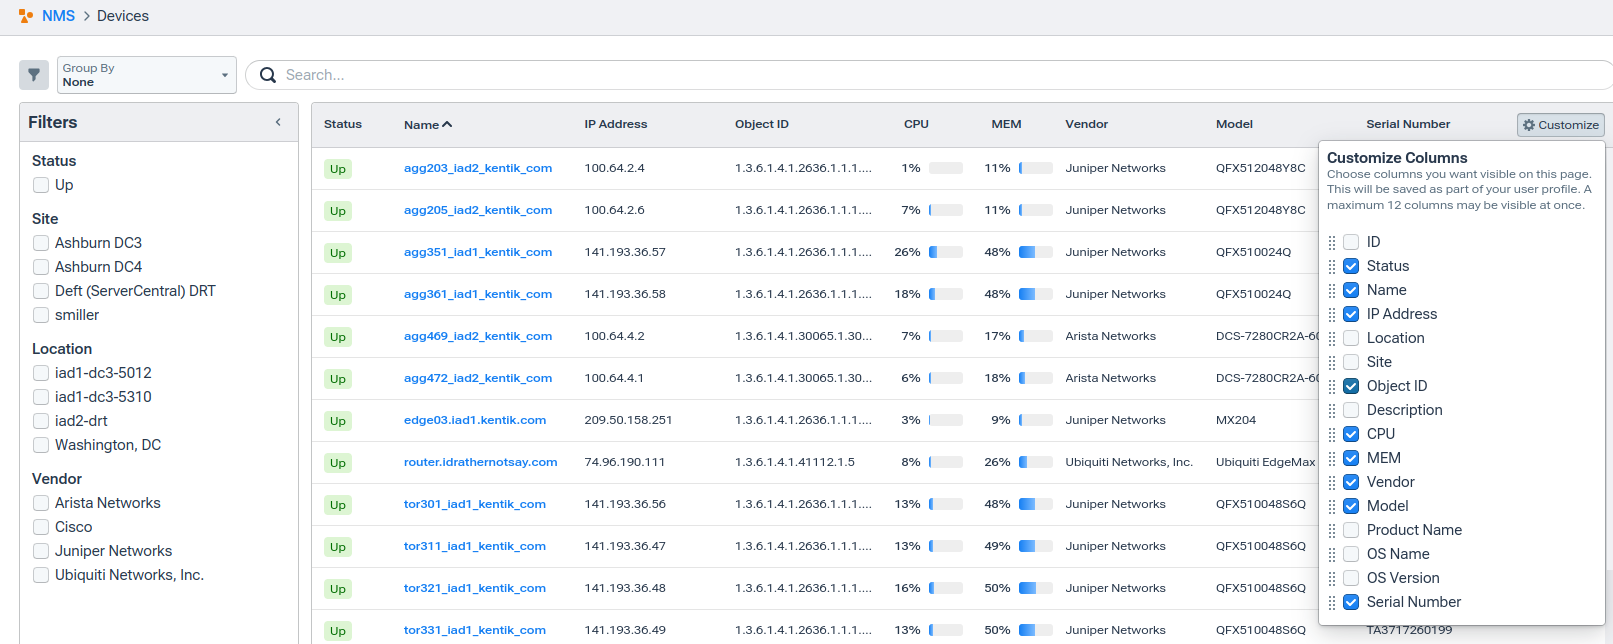
Or if you go to the details page for a specific device and view it in the left-hand column:
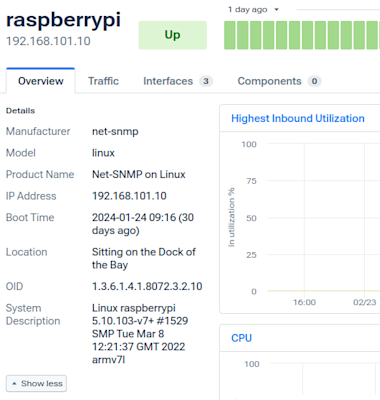
Note that what I’ll be using for this example is 1.3.6.1.4.1.8072.3.2.10
Note that this will affect any Linux-based system because Raspberry Pis don’t have their own unique system ID.
Now we’re ready to get this value added and displayed in Kentik NMS!
This is the lede
I’m not going to hide the important information behind a wall of step-by-step text. This section is the straightforward, simple, direct answer. But it lacks context and detail and, therefore, might not make much sense. That’s what the rest of this post is about. But for those who want to get right to the point:
- Customizations to Kentik NMS all go in
/opt/kentik/components/ranger/local/config. Whether you are adding a custom OID, overwriting an existing OID with a new source (not covered in this post), or adding a new device type (also not covered in this post), it all goes there.- This directory might already exist. If it doesn’t, go ahead and create it yourself.
- In that directory, create three directories:
- /profiles
- /reports
- /sources
- In sources/, create linux-temps_source.yml and add the following information:
version: 1
metadata:
  name: local-linux
  kind: sources
sources:
  CPUtemp: !snmp
    value: 1.3.6.1.4.1.2021.13.16.2.1.3.1
interval: 60s- In reports/, create linux_temps_report.yml and add the following information:
version: 1
metadata:
  name: local-temp
  kind: reports
reports:
  /device/linux/temp:
    fields:
      CPUTemp: !snmp
        value: 1.3.6.1.4.1.2021.13.16.2.1.3.1
        metric: true
interval: 60s- In profiles/, create a file named local-net-snmp.yml and add the following information:
version: 1
metadata:
  name: local-net-snmp
  kind: profile
profile:
  match:
    sysobjectid:
      - 1.3.6.1.4.1.8072.*
  reports:
    - local-temp
  include:
- device_name_ip- Make the user:group “kentik:kentik” the owner of everything you just created and all the files and directories beneath it.
sudo chown -R kentik:kentik
/opt/kentik/components/ranger/local/config
Note: This is only necessary if you’re running the Kentik NMS agent on a regular Linux system whether it’s a VM or not. This isn’t necessary for Docker-based agents, but I’ll explicitly cover that in a later section.
- Restart the collector process (kagent):
sudo systemctl restart kagent.service
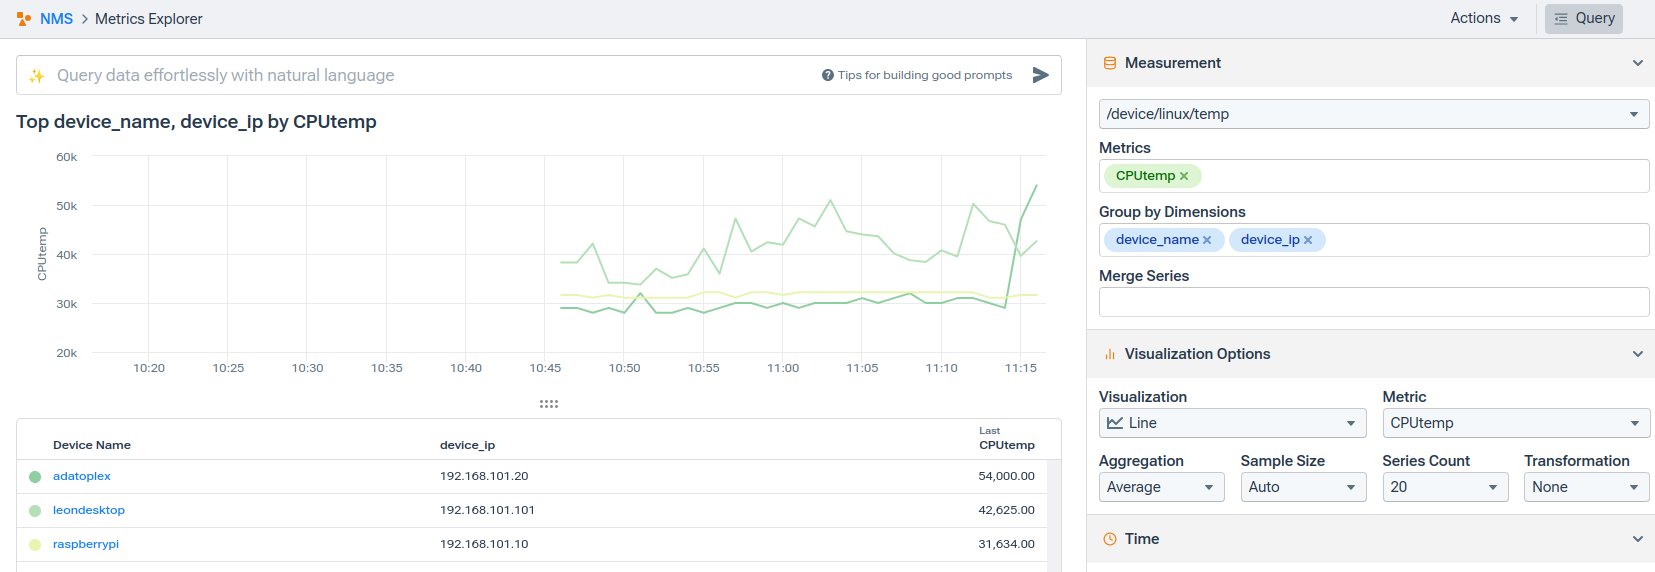
Wait a polling cycle or two, and you’ll be able to see it in the Metrics Explorer:
Unpacking Kentik NMS
The previous section presented a lot of information in a very tight package. It was probably just enough for folks who are already familiar with NMS and its internal structures. But if you’re newer to the platform, you may be looking for additional information, detail, or context. That’s what I plan to present in the rest of this post.
Kentik NMS is, at its heart, a straightforward set of processes and directories. When you install it, all the essential files will be located in /opt/kentik/components/ranger/current.
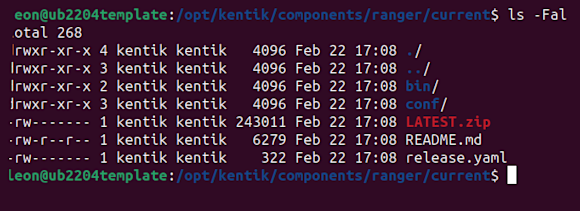
The LATEST.ZIP file contains all of the device profiles and information needed to collect data from those devices. The beauty of this system is that NMS works with LATEST.ZIP as-is, without unpacking or unzipping it. Every time you restart the Kentik agent (kagent), it checks for a newer version and downloads it if necessary. So you’re guaranteed to get all the latest updates and goodies without any special upgrade process.
Note: Sharp-eyed Linux-literate readers will notice that “current” is actually a symbolic link to the latest version. This is important because if you make changes here, you’ll find those changes inexplicably lost after the next update.
Upshot: Avoid future headaches. Don’t make changes in this directory.
If you did unpack LATEST.ZIP (but, as I said, don’t), you’d find a specific directory structure underneath it.

The key directories there are Profiles, Reports, and Sources. Each one contains a set of YAML files defining an aspect of the collected data.
Important note: The names of the files aren’t important. What matters is the information you provide in the name: element within each YAML file. That will allow you to connect or associate a profile to a report, a report to a source, and so on.
Source files
A source tells Kentik NMS about one or more OIDS to collect. Here’s an example:
version: 1
metadata:
  name: local-linux
  kind: sources
sources:
  temp: !snmp
    value: 1.3.6.1.4.1.2021.13.16.2.1.3.1
    interval: 60s
This file can be understood as:
- A source named “local-linux”
- The type (or kind) of file is a “source” (there are others, which you’ll understand in a minute)
- The collection method is SNMP
- The SNMP object (OID) to collect is
1.3.6.1.4.1.2021.13.16.2.1.3.1 - That value should be collected every 60 seconds
Report files
Files in the Report folder tell Kentik NMS how to display a specific OID within the Metrics Explorer. There are sements that repeat the things in the Source file, but – for reasons beyond the scope of this post – they’re necessary in both files.
Here’s an example:
version: 1
metadata:
  name: local-temp
  kind: reports
reports:
  /device/linux/temp:
    fields:
      CPUTemp: !snmp
        value: 1.3.6.1.4.1.2021.13.16.2.1.3.1
        metric: true
    interval: 60s
This information can be parsed as follows:
- The name of this report is local-temp
- The type (or “kind”) of file is – somewhat obviously – a report
- Within Metrics Explorer, the data being collected will show up under /device/linux/temp
- The data elements that will be available in Metrics Explorer is “CPUTemp,” which is an SNMP data element
- This element will contain the data collected by the SNMP OID
1.3.6.1.4.1.2021.13.16.2.1.3.1 - Which is a metric rather than a table or some other type of data structure.
- This element will contain the data collected by the SNMP OID
- The data will be displayed in 60-second increments.
Profile files
Profiles associate specific reports with the device types (as identified by their SNMP System Object ID, or sysobjectid) and also mention common data elements (like name, or IP) that should be associated with the data.
version: 1
metadata:
  name: local-net-snmp
  kind: profile
profile:
  match:
    sysobjectid:
      - 1.3.6.1.4.1.8072.*
  reports:
    - local-temp
  include:
    - device_name_ip
One more time, let’s parse this out:
- The name of the profile is local-net-temp
- The type (or kind, there’s that word again) of the file is a profile
- This profile applies to anything with an SNMP SysObjectID starting with
1.3.6.1.4.1.8072.*(this means most Linux-type machines that run net-SNMP). - Devices that match this profile will collect data found in the Report file with a name: element “local-temp.”
- The device name and IP data should be included along with the data in the local-temp report and associated source.
It’s cool to be kind
You may have noticed that the kind element in all three files above identifies the file type and matches the file’s directory. If you have a nagging suspicion that the directory structure matches up with the Kind label, you are right.
In fact, you don’t actually need the directories. You could put all your files in a single folder, and as long as the Kind: value was correct, everything would match up. We here at Kentik encourage you to use the three-directory approach because it makes organizing, tracking, and maintaining a large number of profiles much easier in the long run.
Possession is 9/10ths of the law and 10/10ths of Linux permissions
Once all your files are in place, it’s important to ensure Kentik can access them. This comes down to giving ownership to both the “kentik” user and the “kentik” group.
Remembering that all of your customizations will go in the folder /opt/kentik/components/ranger/local/config we need to make sure everything you just created will be owned by the kentik user and group. The command to give ownership would be:
sudo chown -R kentik:kentik /opt/kentik/components/ranger/local/configNote: This is only necessary if you’re running the Kentik NMS agent on a regular Linux system, whether it’s a VM or not. This isn’t necessary for docker-based agents, but I’ll explicitly cover that in a later section.
Finally, restart the collector process (kagent):
sudo systemctl edit kagent.serviceWait a polling cycle or two, and you’ll be able to see it in the Metrics Explorer:

Keeping Kentik contained (in Docker)
Throughout this post, I’ve focused on the commands and options for the direct installation of the Kentik agent. If you’re running the containerized version, very little changes, but it’s still worth running through those differences for folks who prefer the Docker version of the Kentik NMS collector.
Docker for the easily distracted
Before we move on, I don’t want to presume that every reader is already familiar – let alone comfortable – with Docker and its basic commands. Here are a few that you might need.
You can see which containers are running (along with their container IDs) with the following command:
docker psYou can see an output of what a Docker container is doing with this command (you get the container ID with the docker ps command):
docker logs –follow <container id>Finally, if you have issues with any containers, including the command to build or run the Kentik agent, you can easily stop and remove a container with these commands:
docker stop <container id>
docker rm <container id>
Getting a custom folder into a container
For the Docker version of Kentik NMS, you will need to mount your custom folder into the container and add that path to the Kentik agent command line. What is that custom folder, you ask? If you’ve been paying attention, you can probably already guess:
/opt/kentik/components/ranger/local/configThat’s right, it’s the same folder we’ve already been working with.
Starting with the “docker run” command that you used to install the container in the first place:
docker run --name=kagent --detach --restart unless-stopped --pull=always --cap-add NET_RAW --env K_COMPANY_ID=1234567 --env K_API_ROOT=grpc.api.kentik.com:443 --mount source=kagent-data,target=/opt/kentik/ kentik/kagent:latestYou would simply add
-v /opt/kentik/components/ranger/local/config…to the end of that command.
The full command would look like this:
docker run --name=kagent --detach --restart unless-stopped --pull=always --cap-add NET_RAW --env K_COMPANY_ID=1234567 --env K_API_ROOT=grpc.api.kentik.com:443 --mount source=kagent-data,target=/opt/kentik/ kentik/kagent:latest -v /opt/kentik/components/ranger/local/configThat’s it! Everything else in this post still applies, and you don’t even need to run the chown command to ensure ownership of that directory.
Troubleshooting and other swear words
Despite our best efforts, careful planning, detailed analysis, and heartfelt prayers – even with all that, things sometimes go awry. As the philosopher John Bender said in the profoundly philosophical work The Breakfast Club.
With that great truth firmly in mind, I wanted to offer some tools and techniques you can use to identify where things may have gone off the rails.
YAML for the easily distracted
YAML stands for “yet another markup language,” which, like most acronyms, tells you exactly nothing about it. YAML is similar in many ways to XML or JSON, an insight that provides little comfort to many of us who have an emotionally complicated relationship with those other two systems.
My personal trauma aside, YAML is great for configuration files because it’s highly structured. But for that same reason, it can be easy to bork something up because of a small (and hard-to-find) oversight. Here are the ones that might trip you up:
- Everything you do in a YAML file will be in the form of a pair of information that follows the pattern: “key: value”
- Some examples:
- name: local-temp
- kind: profile
- interval: 60s
- Some examples:
- Underscores, dashes, or spaces can separate words in keys.
- A key will always end with a colon (:)
- Indentation in the file matters!
- You must have them.
- There must be a certain number of spaces.
- Indents must use spaces. They can not be tabs.
- Things that are on the same level (“name” and “kind,” for example) must line up with the same number of spaces.
Stop, start, restart, do the Hokey Pokey
Sometimes, the Kentik agent needs a good swift kick in the… process. To do that, you can use the systemctl utility:
sudo systemctl stop kagent.servicesudo systemctl start kagent.servicesudo systemctl restart kagent.service
Snooping around the Kentik Agent’s diary (journal)
The Linux journal isn’t some specialized magazine or email newsletter. It’s the onboard record of every outbound message, error, update, whine, sigh, and grumble that your Linux system experiences – especially when it concerns services that run through the systemctl utility.
The command to peer inside the Journal is, appropriately enough, journalctl. But typing that by itself will likely yield a metric tonne of mostly irrelevant information. In order to see messages and output specific to Kentik NMS, you should use the command:
sudo journalctl -u kagentIf that list is overwhelming, include the following bit:
sudo journalctl -u kagent –since "10 minutes ago"And if you want to see the messages appearing in the Journal in real time, use this:
sudo journalctl -u kagent -fThe (mostly) unnecessary summary
There is more – a whole lot more! – to explore with Kentik NMS, including ways to add SNMP table data, create profiles for completely new device types, and even add data that isn’t coming from SNMP in the first place.
Even so, this post should get you moving ahead in collecting those bits of information you know are available on your devices but aren’t collected by default by Kentik NMS today.
To get started with Kentik NMS, sign up for a free 30-day trial.

