How to Maximize the Value of Streaming Telemetry for Network Monitoring and Analytics

Summary
Kentik explains the advantage that streaming telemetry (also known as streaming network telemetry) brings to network analytics and our approach to leveraging streaming telemetry for maximum value.
Streaming telemetry is no longer an unfamiliar term in the network monitoring realm. In fact, interest in streaming telemetry has been increasing over recent years, while SNMP (Simple Network Management Protocol) is falling, according to Google Trends:

What is Streaming Telemetry?
Streaming telemetry, also known as streaming network telemetry, is an innovative method of real-time data collection. Network devices such as routers, switches, and firewalls continually send data about the network’s health and functionality to a centralized location. This system provides a robust platform to access a wide array of metrics that modern network devices generate, effectively addressing the challenges posed by next-generation networks. Streaming telemetry is the comprehensive practice of transmitting measurements from various sources to a receiving station for storage and further analysis, ultimately streamlining network management.
Steaming telemetry uses a push-based mechanism that transmits data automatically and continuously from various remote network devices (e.g., routers, switches, firewalls, etc.) to a central repository. Selecting a proper telemetry architecture can potentially remove many issues—such as security, scaling, polling gaps, and resource utilization of the polled device—around sending and receiving streaming telemetry data.
In this blog post, we will review the current state of streaming telemetry and its ecosystem, discuss our take on the value that streaming telemetry brings to the network analytics table, and outline Kentik’s approach to powering-up network teams by leveraging streaming telemetry.
Streaming Telemetry: Where are We Now?
Core Technology
Streaming telemetry can potentially accelerate network troubleshooting, automation, and traffic optimization. Core components of the technology to support those goals include:
- Near real-time network data, achieved with push-based data collection
- A programmatic way of configuring and managing network devices, achieved by a data model, which describes the specific metrics and metadata to include (for example, IETF YANG, OpenConfig, and other vendor proprietary models
- A highly-scalable architecture and framework with more data point granularity and superior performance
Streaming Telemetry vs. SNMP
As network complexity increases, especially in large enterprises, traditional monitoring methods like SNMP face real-time visibility and scalability challenges. Streaming telemetry emerges as a modern alternative, addressing the limitations of SNMP in various aspects.
SNMP (Simple Network Management Protocol) is a pull-based model where the monitoring system periodically requests data from network devices. This method can cause delays in detecting issues and consumes considerable resources on both the monitored device and the monitoring system. Additionally, SNMP lacks a standardized data model, leading to inconsistencies in the data collected from different vendors.
On the other hand, streaming telemetry uses a push-based model that allows network devices to stream data continuously and automatically to a centralized location. This approach enables near real-time network data collection, significantly improving the visibility and responsiveness of network monitoring. Streaming telemetry also leverages standardized data models, such as IETF YANG and OpenConfig, promoting consistency in the data collected across various devices and vendors.
By providing real-time visibility, standardized data models, and a more efficient data collection mechanism, streaming telemetry challenges SNMP as the preferred method for network monitoring and analytics in modern enterprises.
The Vendor Ecosystem
Major networking vendors now support streaming telemetry on many of their hardware platforms, including:
- Cisco - OS: IOS XE, XR and Nexus OS; Platform: ASR9K, CRS, NCS 6K
- Juniper - OS: Junos OS; Platform: MX, QFX, EX, vMX
- Arista - EOS
- Nokia - SR OS
- Ciena
- Infinera
- … and many more.
We are also seeing many new open-source projects related to streaming telemetry, such as:
Streaming Telemetry: State of Adoption
With increasing interest from major technology companies and growing support from network hardware vendors, we’re seeing that early deployments of streaming telemetry have picked up speed in recent years, especially in organizations with large-scale infrastructures.
However, since the technology is still not standardized, there are many choices and variables, leading to different flavors of streaming telemetry that could make deployment more complex and slow down adoption. For example:
- Transport options: Many choices like TCP, UDP, and gRPC
- Session Initiation options: Dial-out (i.e., the device sends data to the collector) versus Dial-in (i.e., the collector connects to the device)
- Encoding options: Choices of JSON, XML, and Google Protocol Buffers (GPB)
There’s still a long way to go in standardizing streaming telemetry interfaces, which will ultimately likely boil down to either (1) picking a winner or (2) coming up with some best practice solutions and reference guides on when to use each option.
A long-term commitment to consistency and effort (from both networking vendors and the open-source community) will be required to move the technology forward over the coming years. As such, we expect that SNMP and streaming telemetry will coexist for a very long time.
The gNMI Protocol
A new specification, gRPC Network Management Interface (gNMI), is currently one of the main efforts to standardize streaming telemetry and other areas of network management. gNMI is a gRPC-based protocol for state management on network elements. Current participants in the project include big tech brands such as Google, Facebook, Microsoft, Apple, Netflix, AT&T, T-mobile, Comcast, and others.
From a streaming telemetry perspective, the goal of gNMI is to normalize and control telemetry streams across multiple vendors with consistent data elements and interfaces for data collection.
Combining Streaming Telemetry with Other Data Sources
From the network operations perspective, streaming telemetry can improve efficiency in many use cases, including:
- Detecting problems by setting up network monitors and alerts based on pre-configured thresholds or network performance baselines
- Troubleshooting connectivity and performance issues
- Planning for network capacity according to usage and budgets
- And much more… especially when we can use AI or machine-learning techniques to make automated decisions based on telemetry data.
However, streaming telemetry shouldn’t be the only data source that drives these capabilities. As an example:
As a network operator, let’s say that you want to be notified when utilization is high for critical backbone links. The next step would be to determine the characteristics of the traffic that are driving up utilization. For example, which applications, clients, and servers are prominent on the highly-utilized links and can thus be used to make various optimization decisions (e.g., changing traffic patterns)?
An appropriate approach could be:
- Use streaming telemetry metrics as a set of indicators of thresholds and then
- Use NetFlow to figure out what type of traffic is causing it.
As another example, streaming telemetry can also report real-time information on packet drops across links. This information can then be used via a network automation workflow to provision new paths and optimize traffic across the network.
The idea is to correlate all relevant data with multidimensional data enrichment ― regardless of whether the data is sourced from streaming telemetry, network flows, or events and logs ― to see the bigger picture and learn the story behind the superficial symptoms.
Kentik’s Approach to Streaming Telemetry
At Kentik, we’ve been evaluating the market readiness to support this exciting technology, and current customers have asked for streaming telemetry support to help take advantage of the wide variety of data that can be sourced from streaming telemetry sources.
That’s why Kentik now officially supports an MVP release of streaming telemetry.
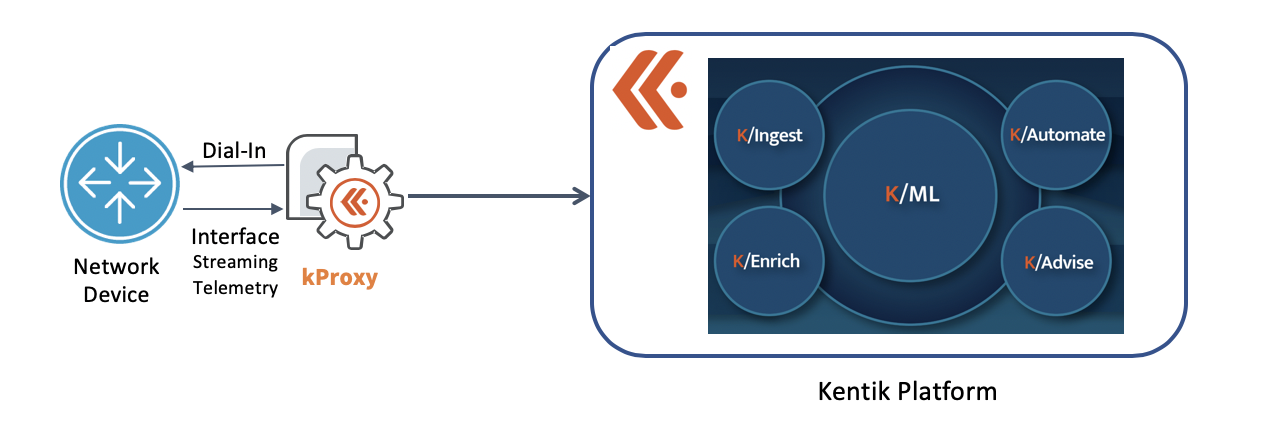
We are bringing all of our innovation for flow data to streaming telemetry. Unlike traditional approaches, Kentik’s AIOps platform for network monitoring and analytics allows users to easily combine flow data with streaming telemetry. Kentik’s backend architecture is designed to receive a high volume of streaming data, contextualized with Interface Classification, flow enhancements, flow tagging, and more.
Kentik gives real meaning to the data, which is one of the major differentiators compared to other tools in the market today. Legacy tools may be able to collect the data but do not provide deep insights into it.
As shown below, Kentik ingests telemetry data at scale, just like every other type of data we collect. Then via enrichment and machine learning, Kentik surfaces potential problems in real-time so that network teams can quickly and accurately respond to incidents, proactively recognize and prevent issues from impacting service and business, and focus on network optimization rather than firefighting.

Additionally, we have a robust roadmap of capabilities that will dramatically expand the usefulness of an already-powerful technology over time.
Current Support and Roadmap
Kentik’s product team has always employed a user-centric approach to feature development. We usually implement features in multiple phases, in order to gather feedback from customers as we iterate during the development process.
The thought process behind this is to design a scalable mechanism for ingesting and storing data, along with UI components, so we can lay down a solid architectural foundation to leverage streaming telemetry. Second, we bring basic support to customers to gather feedback and evolve iteratively. Third, we combine everything, normalize the requirements, and build the workflow to collect metrics and understand the data.
Kentik’s Phase 1 support for streaming telemetry includes:
- Direct collection of telemetry data
- Interface classification support
- Support for Juniper “gNMI” JTI with UI support
- Interface metrics (partial support)
Please contact our Customer Success Team if you want to get a preview of this early version of streaming telemetry support.
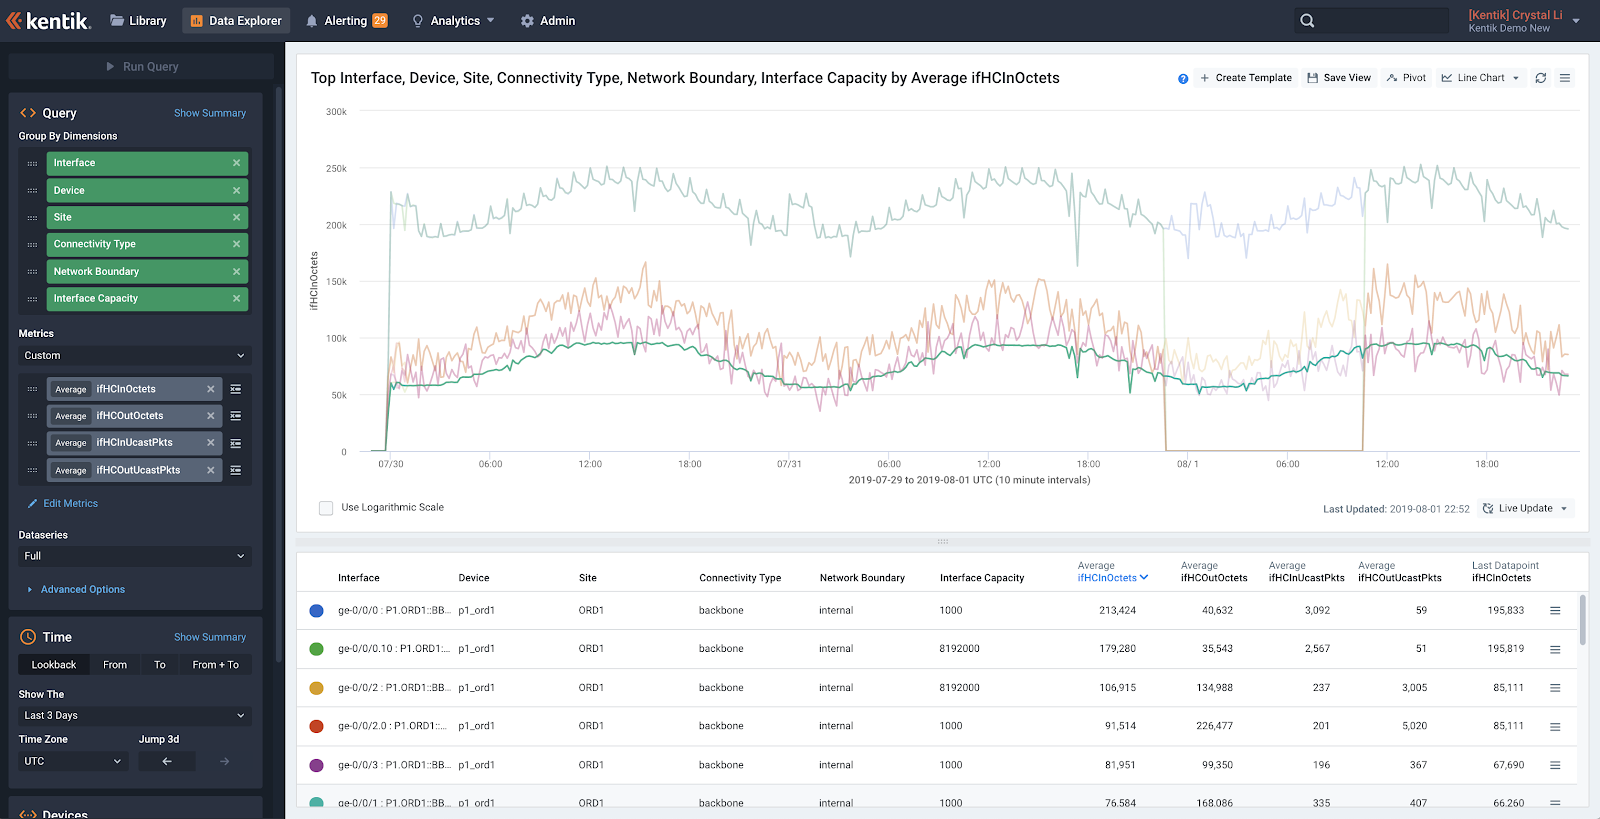
With access to the streaming telemetry features, you can get statistics and visualizations of network ingress and egress traffic, via which interfaces, with connectivity types and other relevant data:


In subsequent phases, we will add support for more vendors (e.g., Cisco Dial-Out for ASR), full interface metrics, more sample interval options, full alerting on metrics and state changes, and much more. The goals are to eliminate gaps in visibility, understand the complete health of the network, and relate this information to applications and traffic throughout the entire infrastructure.
Conclusion
Digital businesses drive the fastest revenue growth in history, and networks underpin all of it. New network monitoring and management capabilities are in urgent demand, and streaming telemetry is filling the visibility gap by providing real-time and HD-like visibility. Consuming telemetry data at scale while correlating it with all the other aspects of network context can be challenging. Kentik is well on the way to solving this difficult network monitoring problem.
To be the first to know about our latest developments, subscribe to the Kentik blog. You can also request a personalized demo to see Kentik’s powerful network analytics—and our latest streaming telemetry features—for yourself.


