How to Use Kentik to Perform a Forensic Analysis After a Security Breach

Summary
In this post, Phil Gervasi uses the power of Kentik’s data-driven network observability platform to visualize network traffic moving globally among public cloud providers and then perform a forensic analysis after a major security incident.
Kentik provides a macro view of how your cloud traffic moves among and within regions and also granular visibility of very specific traffic moving among regions, countries, data centers, and down to specific applications and endpoints.
Having a single view of all these cloud components, including their connections to on-premises resources, means engineers have the ability to identify compliance issues, spot inefficient movement of traffic, troubleshoot application performance problems, and perform forensic analyses after a security incident.
The scenario
In this post, we’ll explore a scenario in which we had a serious security incident. As part of our analysis, we need to learn how the attacker gained entry, what specific devices were compromised, and the extent of the data exfiltration.
To set the stage, our security tool alerted us to a suspected attack. Numerous connection attempts on port 22 were made to our public-facing host in our Azure east US region. A spike in connection attempts and traffic would show up as anomalous behavior with most popular SIEMS; however, we need to confirm that this is indeed a security incident and not a false positive, and along with understanding the nature of the data exfiltration, we need to know if data crossed international boundaries, a serious compliance violation in many highly regulated industries.
The Kentik Map
The Kentik Map is a great way to see an overview of on-prem data centers, branch offices, internet connections, and all your public cloud resources. Seeing this data overlaid on a geographic map allows you to get a quick glance at how traffic is moving among all your locations, including across international boundaries.

First, we need to find out the source of the attack and where the attacker is in the world geographically. A robust security tool would also give you the attacker’s IP as well, but in our workflow, we need to go beyond IPs to understand the nature of the flows and where our attacker is located geographically.
We can start by drilling down into our east US site and see if there’s anything there that can help start us off.
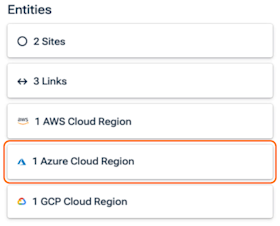
Notice in the image on the right, when we select our geographic region, we can see what resources we have there, including Azure east US. Having quick access to all the sites in a specific region, whether on-prem or cloud, means engineers are seeing all their networks in one place rather than with multiple screens or tools.
When we continue to drill down into our Azure east US region, we can see the Cloud Region Details, which gives us a quick glance of historical traffic.
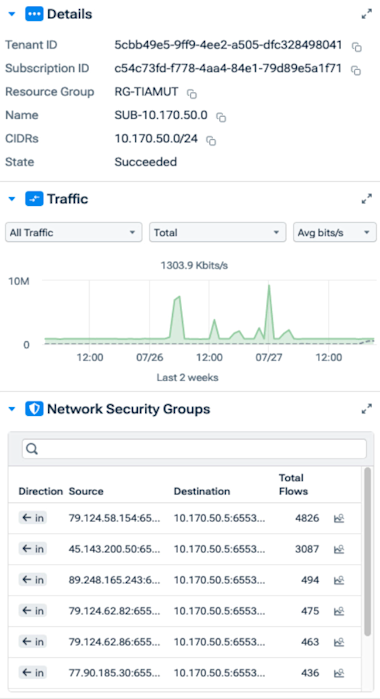
In the image above, notice we get some quick details about our region, such as the Tenant ID, Name, CIDRs, and so on. We can see a traffic summary that can be filtered depending on application, total or average, and using bits/s, flows, packets, etc.
And lastly, we can also view the total flows according to the Azure network security group.
Notice below that we can see an animation showing the connections this subnet is making and the connections the entire region is making.

Now that we’ve confirmed the indicator of compromise in the security alert, we can begin to analyze further. To filter and explore the underlying data, we can use the Kentik Data Explorer.
Understanding the attack vector
We can run a query to understand better what was hitting the affected Azure host. We know the IPs from the security alert, but by using Data Explorer, we can see all the traffic over time and get a better understanding of what led up to the breach.
From the data sources, we select Azure (since our host is in Azure and we can use those logs), but notice we can select multiple data sources or even all of them if we’d like.

From the dimensions menu, we’ll select source IP, source port, destination IP, destination region in Azure, and Firewall Action. We should also capture the source country from our geolocation option because we want to know if data is leaving our Azure east US region across international boundaries, and we also want to know the application.

Also, we can modify the custom filter to narrow the scope to just our Azure host. Lastly, we can change the time range to the last several weeks. This will give us a good picture of what outside IP addresses are trying to make connections to our host.

The results of this first query, which you can see below, show a lot of connection attempts to our host in public-facing Azure over ssh. Since this is a public host and ssh is allowed, we’re seeing all Allow statements from the firewall, which is expected. However, notice all the connection attempts are from one IP address with nominal or zero data transfer.
This is indicative of TCP resets after a failed logon attempt. And now that we confirmed the IP address of the attacker, our source country, and see a flow at the top of the list with significant data transfer, we have a point in time that we can use to isolate the logs locally on the host itself.
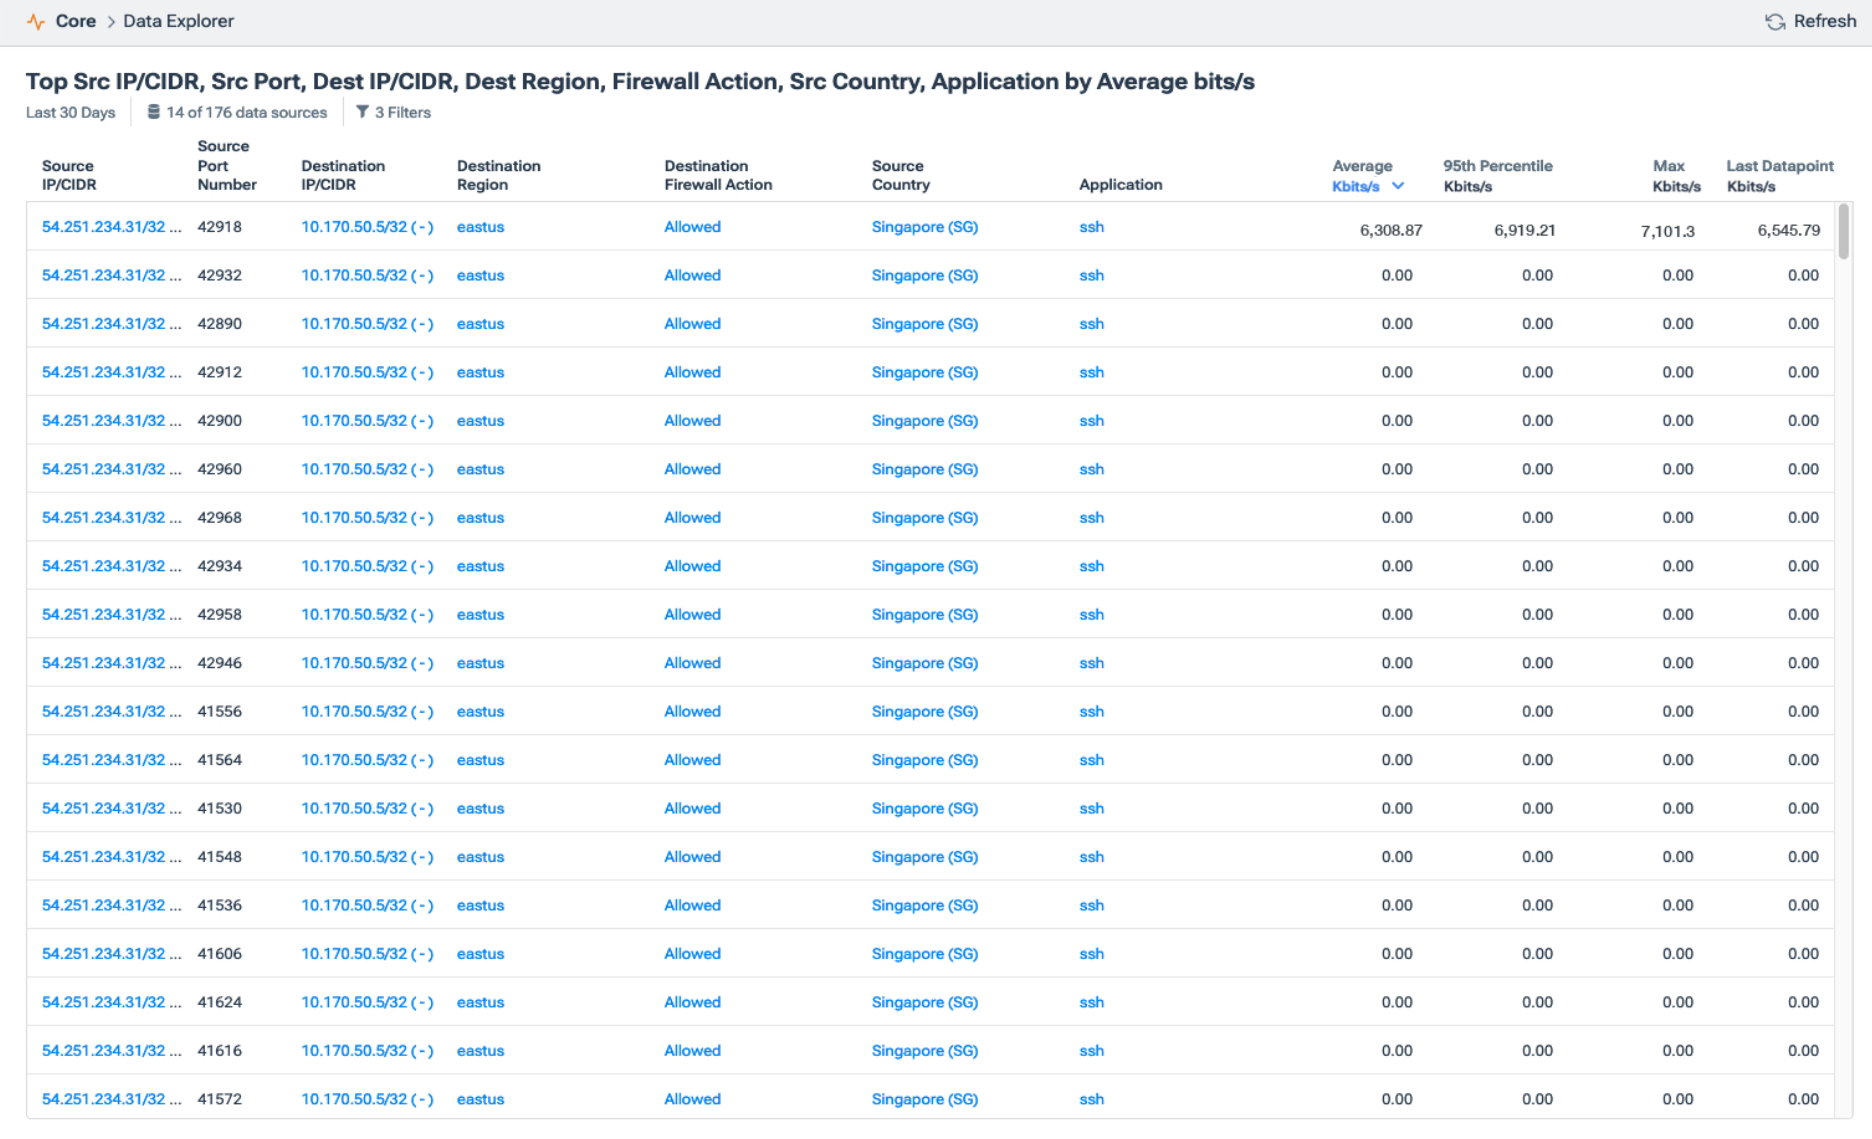
Thus far, our host in Azure was targeted on port 22 repeatedly using different source ports, which our SIEM identified as an indicator of compromise, presumably different login credentials until finally, the attacker could gain entry.
Looking at lateral traffic internally
Next, we can drill down on our compromised host and pivot to internal visibility. This will allow us to see if the compromised host talked to anything internally that may have also been compromised. Looking at lateral movement is one of Kentik’s strengths.
Our dimension will include the source and destination as well as the application, and we’ll change the filter so our source is the Azure host with IP address 10.170.50.5. We can leave the destination blank, but we should exclude our attacker’s IP so we see only what else our host talked to laterally within our own network.
The results of this query, as seen below, show numerous connections to one inside host at 10.170.100.10, all with minimal data transfer and on various ports. This is certainly indicative of a scan of some type, likely in an attempt to find a means of accessing this inside host. And notice that our Azure host at 10.170.50.5 eventually initiates significant MySQL data transfer with the inside host at 10.170.100.10.

Now that we have evidence of another compromised host and a likely data exfiltration, we can change the filter to focus on just these IPs and MySQL and ssh in a time series to compare.
Our first filter rule isolates the lateral traffic within Azure, and my second filter isolates the traffic between my Azure host and the attacker, which should be a similar amount of ssh traffic, though it doesn’t necessarily have to be. For this visualization, I’ll enable bi-directional mode to more easily see the correlation.
In the results below, we see clearly that the spike for both MySQL inside and ssh outbound happened simultaneously. Also, the two values are very close in the actual amount of traffic.

The forensic analysis workflow
- We started by confirming our alert from our security tool was valid and not a false positive.
- We verified that an attacker scanned our outside host and identified port 22 as open.
- Based on the data, we assume that the attacker then initiated a brute force dictionary attack, as evidenced by the many ssh connections with very minimal traffic, followed by a successful attempt with much more traffic.
- Then, with this open connection, our attacker was able to identify an internal host running MySQL. We saw the data transfer internally, and then we saw the data transfer back to the attacker.
At this point, we can hand this off to our security team to look into the system logs themselves and probably revisit the ssh credentials on our outside host and MySQL credentials on the inside host. Depending on what they find, they also implement two-factor authentication and a brute force prevention mechanism like fail2ban.
Ultimately, visibility is a cornerstone of effective cybersecurity. Kentik’s data-driven approach to network observability provides engineers with the tools they need to make informed decisions to remediate problems and improve their security posture.
Watch the demo video to see this entire forensic analysis step-by-step.
