Summary
In our last blog post, At The Turning Point: FinServ Data Networks, we discussed the challenges faced by financial services organizations when it comes to managing modern networks. In this post, we dig a little deeper with real-world examples of how Kentik helps our financial industry customers solve these challenges. Before we dive into the specifics, let’s take a look at a few aspects of Kentik Detect® that make this possible:
- Unlimited scale, no compromises – The Kentik Data Engine (KDE) was built using a modern distributed systems architecture so it can scale horizontally to any network size, retain the raw data for 90 days or more, and provide the details you need in seconds. Networking teams no longer need to be limited by unresponsive tools, aggregated stats, and data deadends. For a deeper dive on KDE, check out our product page.
- Comprehensive detection – Kentik’s policy-based alerting engine continuously evaluates incoming network data to detect anomalies and trigger notifications or automatic actions. Users can choose from a library of pre-built policies, or create new policies with custom traffic filters, baselines and threshold conditions. For more information check out our alerting blog post.
- Business context – Custom Dimensions map business data (i.e. identifiers like customer names, locations, and services) onto network traffic data. This allows non-technical stakeholders from product, marketing, sales, management, and executives to understand the data and gain insight in terms that are relevant to their roles. To learn more about Custom Dimensions, check out our Knowledge Base article.
- Your data, your way – Fully customizable and interlinked dashboards allow Kentik Detect to adapt to each user’s workflows, not the other way around. Technical stakeholders from operations, security, and application teams can build their own views oriented to their role, and also curate data to create a “UI within the UI” for sales, finance, executives, and others. For more information, check out our Dashboards Knowledge Base article.
With these things in mind, let’s take a look at a few examples of how our FinServ customers use Kentik Detect to solve real-world problems.
The Big Picture
One of the more obvious, yet powerful uses for Kentik Detect is a dashboard that provides a comprehensive overview of network traffic across the entire infrastructure: LAN / WAN, internal data centers and public cloud. To illustrate this we will imagine a company called ACME Bank & Investments with a dashboard called ACME Bank & Investments Network Overview.
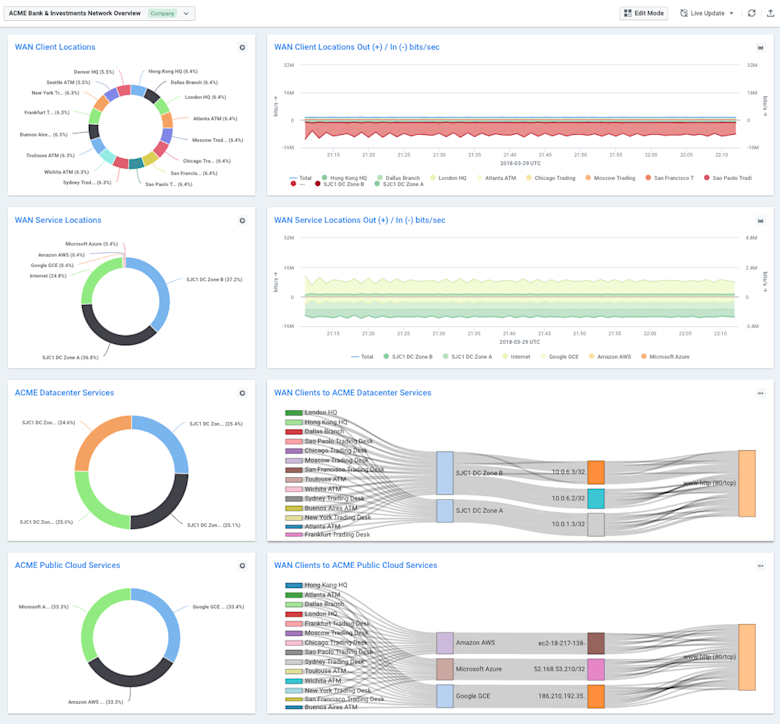
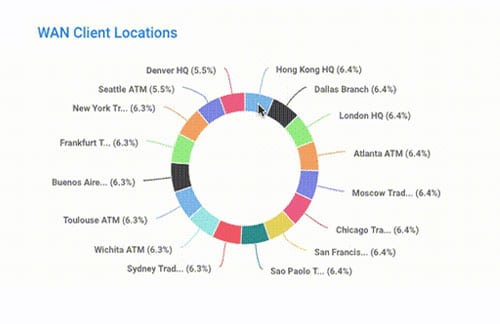
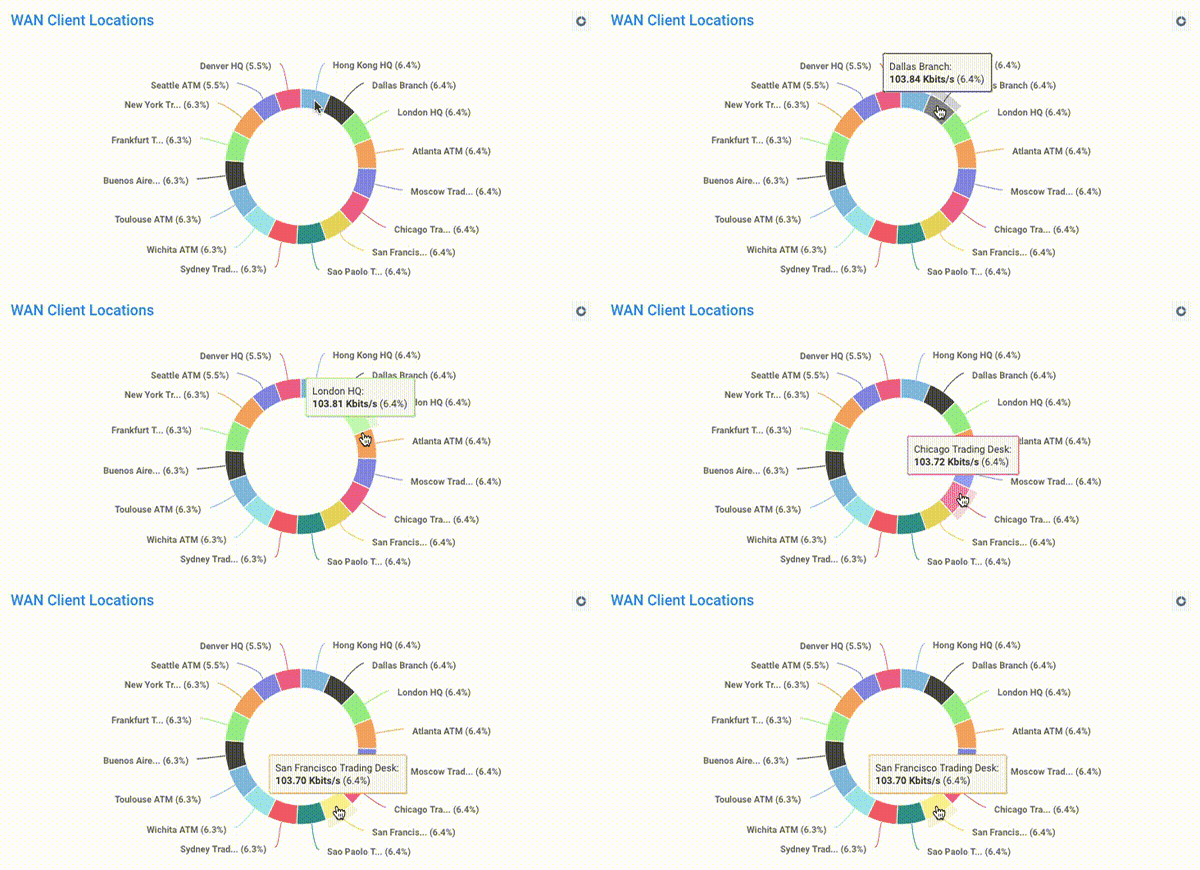
This first panel shows traffic per location across their WAN: banking branches, ATMs, HQ buildings, trading desks, etc.
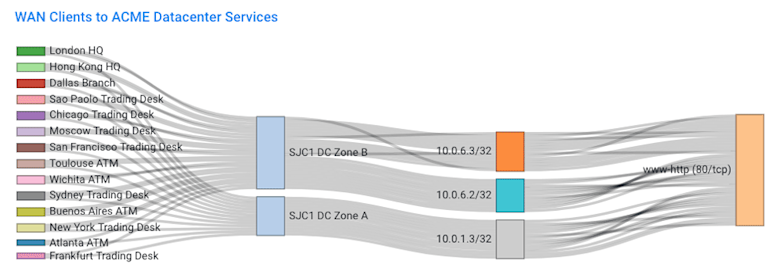
In the next panel we’ll take a look at the relationships between clients across ACME’s WAN and services running in their internal data center in San Jose (SJC1). The Sankey diagram illustrates the utilization across datacenter zones, server IPs, and services. Kentik makes extensive use of the Sankey visualization type to illustrate relationships within network data. (Read more on our Sankeys in our blog post Insight Delivered: The Power of Sankey Diagrams.)
With a simple filter change, another panel illustrates traffic flows between WAN locations and public cloud services.
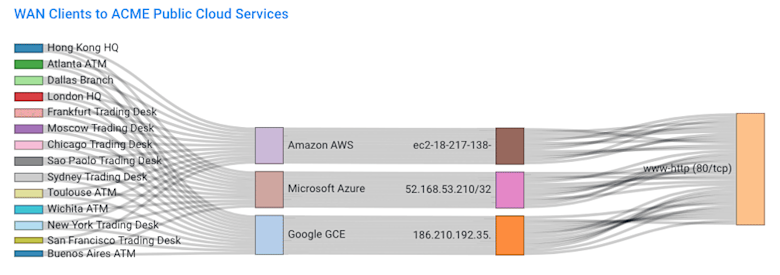
Panels can be set to auto-refresh every 30, 60, or 90 seconds, making it easy to verify traffic flows during network maintenance or while troubleshooting active events. Panels can also be navigationally linked to other dashboards, or can drill down to fine details using the Data Explorer.
Is It The Network?
Network operations teams are usually “guilty until proven innocent.” Application performance problems are often blamed on the network unless ops teams can provide data to demonstrate otherwise. Getting that data has historically been a huge challenge. Traditional tooling is often not deployed where and when the problems occur, and doesn’t retain the details necessary to definitively answer the “was it the network?” question. Kentik Detect solves both those problems. Our kprobe agent deploys anywhere – on servers, VMs, public cloud instances, or sensor hosts connected to packet brokers or taps. The kprobe agent produces flow data enriched with performance metrics and layer 7 details which are stored in the Kentik Data Engine. That enriched data can then trigger proactive notifications about performance problems when they arise, and provide the fine details engineers need to quickly distinguish between application and network performance issues.

Using our ACME Bank & Investments example again, the policy and alert above allows ACME’s networking team to quickly see that an application running on server3_sjc1 in SJC1 Datacenter Zone A is slow in responding to requests. The team can also see the exact HTTP URL where the slow responses were observed. Drilling down on the alert brings up up a dashboard with more detail:

ACME can quickly see that the application’s latency has increased but there has been no change in the packets per second (pps) or bits per second (bps) towards this server. Just to be sure, the team can dive into another panel to compare the application latency (+ axis) with the server latency (- axis):
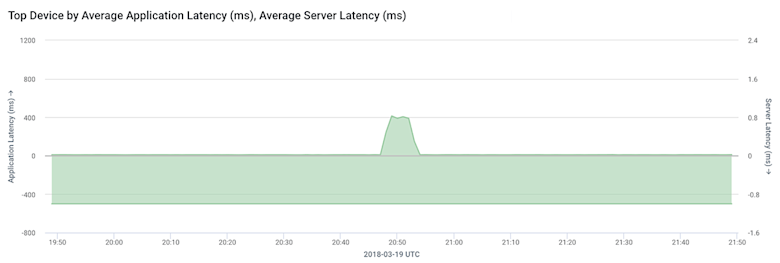
Very quickly the networking team at ACME is able to isolate the problem to an application performance issue instead of a network problem.
Securing Services
Application deployment models have changed dramatically, from monolithic apps that live in a static location, to a distributed services model where app components are deployed and auto-scaled dynamically. That’s made it very difficult for networking teams to get accurate information on the network traffic relationships between service components and clients. Application owners have even less awareness about how their apps and components communicate. That makes deploying security policies like firewall rules or ACLs nearly impossible. If you don’t understand which components and services need to communicate with each other, how can you even begin? Once again, Kentik Detect can help here. We can create a Kentik view for ACME that lists each unique source / dest / service as actually observed on the network:
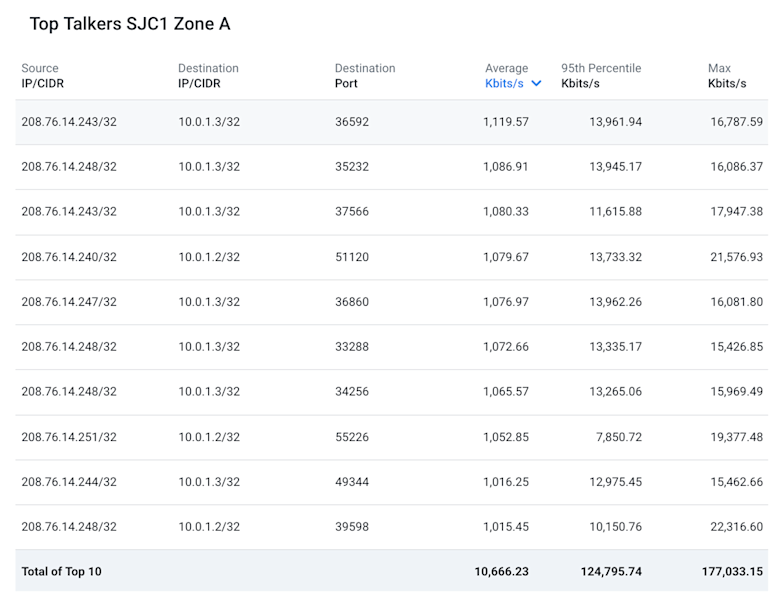
Now the security team can build a ruleset with the confidence that they will not inadvertently block any communication that’s required for the application to function. Even better, they could configure a policy to alert whenever communication occurs which deviates from this list of expected connections.
Summary
These are just a few examples of how Kentik Detect’s modern, scalable approach to collecting, organizing, and displaying network data can help ease the network pain for financial services organizations. If you are not already a Kentik customer and would like to get started analyzing your network traffic today, request a demo or sign up for a free trial.
