Kentik moves up the stack with Synthetic Transaction Monitoring

Summary
Kentik goes up the stack and launched Synthetic Transaction Monitoring (STM). Read this post to learn about enhancements to our synthetic testing capability and how to perform STM in Kentik.
In our quest to provide the leading network observability solution, Kentik has been focused on developing a service for NetOps teams that empowers them to have intimate knowledge of their network traffic and the devices that route traffic. Our service helps them plan capacity, project costs, optimize routes, detect unwanted traffic, troubleshoot issues and analyze events.
In 2020 we launched Kentik Synthetics, which allows NetOps to be more proactive in testing and simulating traffic not only across traditional network resources, but also to and within public cloud resources and recently to software apps. In February of this year we added BGP monitoring to give insights into BGP announcements and withdrawals, detect route leaks and monitor RPKI status.
In a further move up the stack, we recently launched synthetic Page Load testing, which gives our customers the ability to test how a website loads from global locations. Our results give a granular breakdown of how every component on a web page loads so that you can easily identify what’s impacting performance, whether it’s a site hosted on-premises, in the cloud or hosted by a SaaS provider.
Introducing Synthetic Transaction Monitoring
I’m excited to announce that our initial launch of Synthetic Transaction Monitoring (STM) is now GA! There are plenty of Application Performance Monitoring (APM) tools on the market that enable DevOps to get detailed insights into the performance of applications, but none that we are aware of can do this in the context of actual network telemetry.
With this new feature, network teams and site reliability engineers will be able to identify where performance problems are occurring without having to rely on DevOps tools. Kentik provides full visibility of actual network traffic alongside synthetic test traffic – all the way up to measuring the performance of applications by emulating user transactions. (For a more general introduction to the concept of STM, see our Kentipedia entry, “What is Synthetic Transaction Monitoring?”)
Our integrated sharing tools will enable your team to collaborate with other team members via your platform of choice and our public link sharing feature allows users to share test results with unauthenticated users to efficiently instrument troubleshooting sessions internally and externally.
How to set up Synthetic Transaction Monitoring
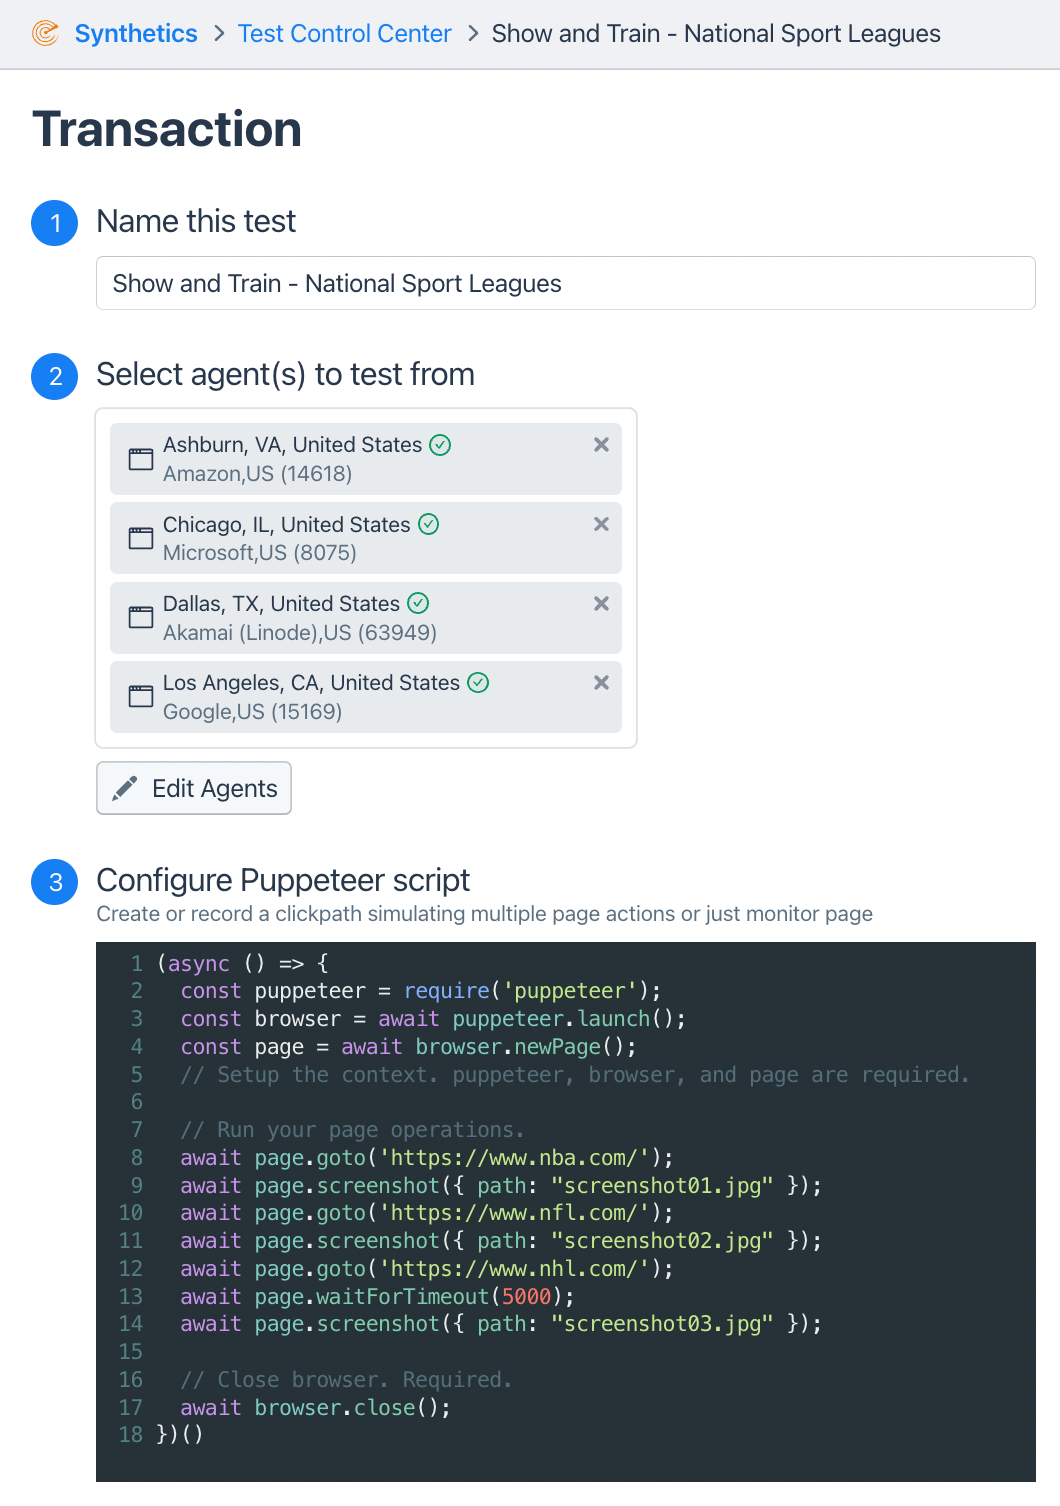
To set up STM in the Kentik portal, you first use Chrome Developer Tools to record the actions a user would take to interact with an application. Once you’ve recorded these steps, you login to your Kentik account and create a test. Here’s what the setup looks like in Kentik:

You can select any of our public application agents to test from, and/or easily deploy your own private Application agents which we can supply (for Docker, x86 and ARM). STM tests can be set as both automatic and periodic on time intervals.
Presentation of Synthetic Test Monitoring results
Results are presented on a timeline that shows transaction completion time. Time intervals can be edited. Performance is measured against dynamically calculated baselines and lags in performance are colored – orange is a warning, red is critical. Selecting a point on the line will indicate total completion time and the rolling standard deviation baseline. Screenshots captured during the transaction process provide insight into the script execution flow and aid in troubleshooting.

The Waterfall tab shows the load order and load duration of each element in the Document Object Model (DOM) of every page visited.

Key differentiators of Kentik Synthetics
While most other synthetics transaction testing tools are implemented on a Selenium framework, at Kentik we chose Puppeteer, a testing framework developed by Google. With nearly identical syntax to Selenium, users get the benefits of a familiar language while also benefiting from a framework that is more tightly coupled with the Google Chrome browser it controls. Every Chrome browser has a transaction recorder built in, avoiding the need to maintain an independent scripting environment.
NetOps teams have long been held back by the lack of affordability of synthetic transaction testing, which meant that only the most critical apps got coverage at less than optimal time intervals. With Kentik you can afford to monitor more apps at lower time intervals with the same or less budget than competitive offerings.
When downtime can cost you dearly in terms of reputation damage and lost revenue, testing every minute won’t cut it. Your critical applications often require sub-minute test frequencies. Only Kentik provides network (ping and traceroute) testing down to one second intervals, which coupled with STM at five minute intervals results in you never missing a possible performance degradation.
As well as the obvious advantage of having a single service to correlate real network telemetry with synthetic test traffic, a significant feature of the Kentik service is that you can use actual traffic to automatically configure and maintain the synthetic tests you should be running. This can save you a huge amount of setup and administration time. If there’s a change in your traffic flows, Kentik will automatically adjust the locations to which you are testing.
Conclusion
We don’t know of any other service that can give network operators the ability to easily visualize real traffic alongside test traffic so they can quickly analyze events and answer any network question. Thanks to our engineering teams for their rapid development and deployment of this feature and to our customers who have guided its development!
Kentik Synthetics is available for a 30-day free trial. Our public agents are available for you to test from so there’s no heavy integration work to get up and running – in no time you’ll be performing STM or page load tests. For more information on the Kentik STM capability view this webinar or contact us for a demo.


