Summary
As last week’s misconfigured BGP routes from backbone provider Level 3 caused Internet outages across the nation, the monitoring and troubleshooting capabilities of Kentik Detect enabled us to identify the most-affected providers and assess the performance impact on our own customers. In this post we show how we did it and how our new ability to alert on performance metrics will make it even easier for Kentik customers to respond rapidly to similar incidents in the future.
Identifying Source and Scope with Kentik Detect

Instrumental Agents
First, let’s touch on some background that will make things clearer when we dig into the specifics of the Level 3 event. All of the front-end nodes that serve our portal are instrumented with our kprobe software host agent. Kprobe looks at the raw packet data in and out of those hosts, turns it into flow records, and passes it into Kentik Detect. One of kprobe’s major advantages is that it can measure performance characteristics — retransmits, network latency, application latency, etc. — that we don’t typically get from flow data that comes from routers and switches. By directly measuring the performance of actual application traffic we avoid a number of the pitfalls inherent to traditional approaches such as ping tests and synthetic transactions, most notably the following:
- Active testing agents can’t be placed everywhere across the huge distribution of sources that will be hitting your application.
- Synthetic tests aren’t very granular; they’re typically performed on multi-minute intervals.
- Synthetic performance measurements aren’t correlated with traffic volume measurements (bps/pps), so there’s no context for understanding how much a given performance problem affected traffic, revenue, or users.
With an infrastructure that’s pervasively instrumented for actual network performance metrics, the above issues disappear. That provides huge benefits to our Ops/SRE team (and to our customers!), particularly along three key dimensions:
- Our instrumentation metrics and methods provide near-instant notification of performance problems, with relevant details automatically included, potentially saving hours of investigative work.
- With the necessary details immediately at our fingertips, we are typically able to make changes right away to address an issue.
- Even if a fix is not immediately possible, the detailed data enables us to react and inform any users that may be impacted.
Kentik delivers our platform on bare metal sitting inside a 3rd party Internet datacenter. Your applications and infrastructure may look different than ours. You might deliver an Internet-facing service from AWS, Azure, or GCE. Or perhaps you have an application in a traditional datacenter delivered to internal users over a WAN. Or possibly you have a microservices architecture with distributed application components. In all of those scenarios, managing network performance is critical for protecting user experience, and all of the benefits listed above still apply.
Exploring the Impact
For analysis of the Level 3 route leak, we opened the Data Explorer section of the Kentik portal and set a query to look at total TCP retransmits per second (an indirect measurement of packet loss) around the time of the incident on November 6. As you can see from the graph below, there’s a noticeable spike in retransmits starting at 9:40 am PST, exactly the time that the Level 3 route leak was reported to have started.

Next we wanted to look at which customer networks were most affected. Building on our original query, we sliced the traffic by Source ASN. Some Kentik users would be inside corporate ASNs (at the office), but with today’s increasingly flexible workforce, there are also many users accessing the portal via consumer broadband ISPs from home, coffee shops, airplanes, etc. In the resulting graph and table (below), we saw lots of Comcast ASNs in the Top-N. This correlates well with anecdotal reports of many Comcast customers experiencing reachability problems to various Internet destinations for the duration of the incident.
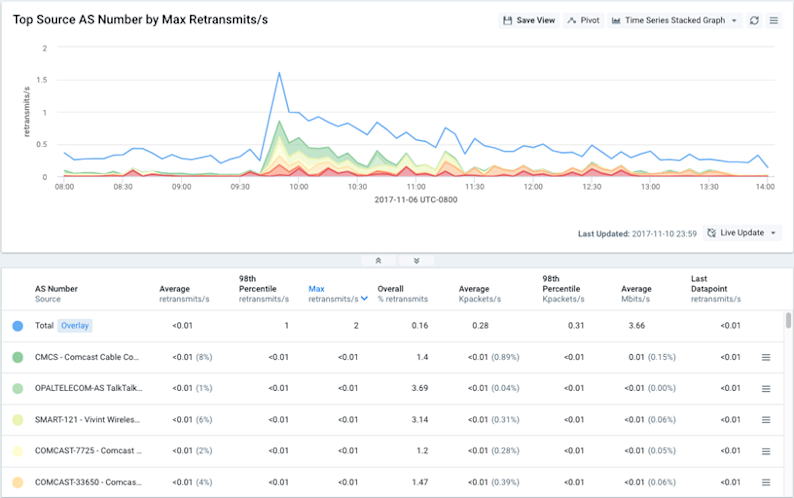
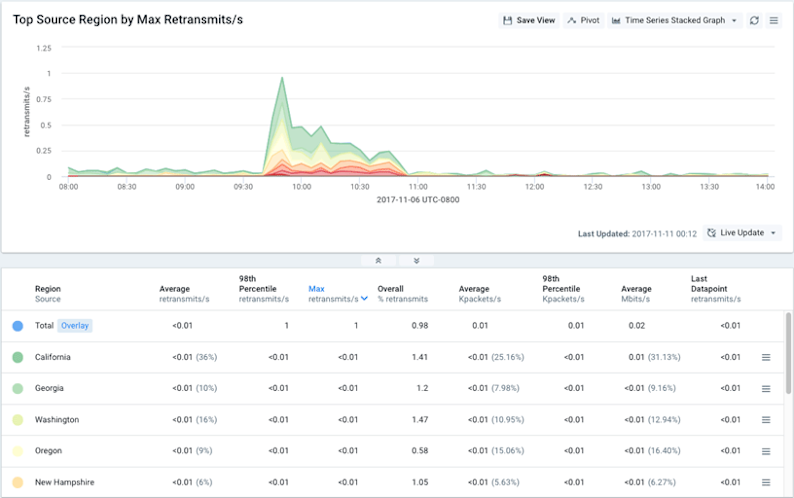
Next we drilled further into the Comcast traffic in order to pinpoint exactly which parts of their network were affected. We filtered to Comcast ASNs only (see below) and changed the group-by dimension to look at source regions.

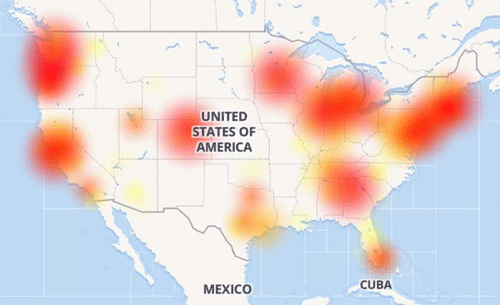
In the resulting graphs and table (below) we saw that the top affected geographies were centered on California, the Pacific Northwest, and the Northeast. That correlates quite nicely with some of the Comcast outage heat maps that were circulating in the press on November 6 (including the Downdetector.com image at the start of this post).
Lastly, we tried to identify the source of the performance issues by looking for a common path between Kentik and the affected origin ASNs. To do so, we looked at retransmits grouped by 2nd hop ASNs (immediately below) and 3rd hop ASNs (below).
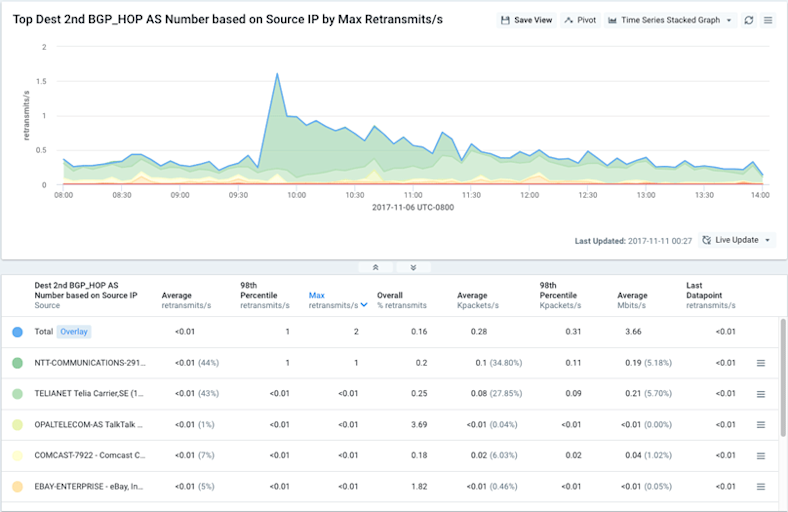
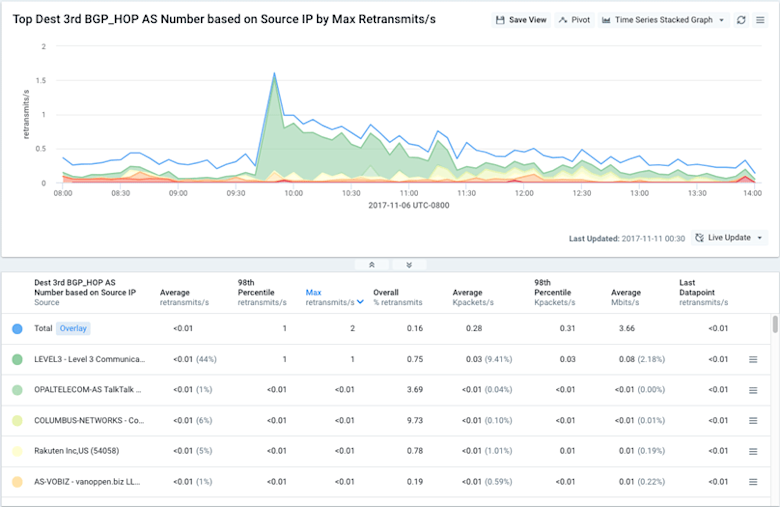
Now the picture became pretty clear: the routes leaked from Level 3 (3rd hop) forced a lot of traffic through NTT America (2nd hop) that would normally have gone to or through Level 3 directly. That appears to have caused a lot of congestion either within NTTA’s network or on the NTTA/Level3 peering interconnects, which caused the packet loss observed in the affected traffic. This explanation — arrived at with just a few quick queries in the portal’s Data Explorer — once again turned out to be well-correlated with other media reports.
Alerting on Performance
Coincidentally, a few days after the Level 3 incident Kentik released new alerting functionality that enables alert policies to watch, learn, and alarm not only on traffic volume characteristics (e.g. bps or pps) but also on the performance metrics provided by kprobe. If we’d had that functionality at the time of the Level 3 event we would have been proactively notified about the performance degradation that we instead uncovered manually in Data Explorer. And while our customers were able to see the effect of the route leak using bps and pps metrics, performance metrics will make possible even earlier detection with higher confidence. We and our service-operating customers are excited that performance-based alarms will now enable us to deliver an even better customer experience.
With digital (and traditional!) enterprises increasingly reliant on the Internet to deliver their business, deep visibility into actual network performance is now essential if you want to ensure that users have a great experience with your service or product. Combining lightweight host agents with an ingest and compute architecture built for Internet scale, Kentik Detect delivers the state-of-the-art analytics needed to monitor and troubleshoot performance across your network infrastructure. Ready to learn more? Contact us to schedule a demo, or sign up today for a free trial.

