UPDATED 3/26/20: Trends in Network Traffic in Correlation with COVID-19


Summary
At Kentik, we’re always interested in monitoring trends in network traffic. This helps to inform our community and customers globally about potential opportunities and threats to network operations. In this ongoing blog post, we’ll provide updates to trends in traffic in correlation with COVID-19.
Updated 3/26/20
We are continuing to monitor traffic trends in correlation with the spread of the coronavirus, COVID-19. After recently observing the 200% network traffic spikes in North America and Asia (see data in our 3/6/20 update below), we wanted to look specifically at the U.S., focusing on states where partial or complete shelter-in-place orders have been issued.
In future updates to this blog post, we will look at traffic by type of delivered service (i.e., gaming, videoconferencing, streaming, and social media), as well as looking into traffic trends for other domestic and international locations.
While we hope these analyses are helpful, we’re grateful for the infrastructure and key SaaS and content services that connect, inform, and entertain us. Thanks to those behind the scenes working and scaling, and our thoughts are also with those affected by the difficulties as they balance family, work, and economic concerns.
Before reviewing the findings below, we’d like to also thank Kentik customers, many of whom give us permission to do aggregate analysis to track traffic trends. The views in this blog post are generated from a cross section of those customers who run service provider networks of various types (e.g., eyeball, cloud, and transit networks).
Network Traffic Across the United States
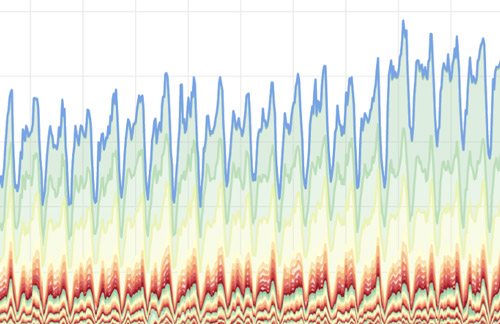
Overall network traffic has been trending up across the U.S., with a slight uptick this week. While some cities have seen faster growth over the last few weeks, traffic overall is up in the tens of percent, and does not show trending towards doubling in the short term.
While some of the European voluntary reductions in streaming quality are starting to make their way to the U.S., with YouTube now issuing a global reset to lower default streaming bitrate, overall we are not seeing systemic congestion, and services are generally scaling well.
We also wanted to look deeper into a couple of states where partial or complete shelter-in-place orders have been issued. The general takeaway is that for states where traffic was already high before the spread of COVID-19 (i.e., California and New York), we will not observe as great of a percentage increase in traffic. Below are our findings.
Network Traffic in California
California has the highest traffic to start with, so while we’ve seen a magnitude of growth in traffic, because our service provider index also counts transit traffic exchanged in regions, the actual percent increase has been less than in some other regions affected first by work-from-home and then work-from-family restrictions.
In future posts, we’ll focus on areas where there have been bigger shifts in traffic in California and other geographies, including time-of-day shifts, views by type of over-the-top services, and traditional work versus residential cities.

Network Traffic in New York
New York has been the second largest geography where we see traffic going to in the U.S. across this service provider index. While there is a fair amount of interconnection between networks that we are counting in these measurements, there is more of a mix of residential and corporate traffic as a percentage.

Network Traffic in Illinois
As we look at geographies where our index sees a higher percentage of residential and corporate networks, including Illinois, we see even greater growth in traffic with the recent shifts to work-from-home and shelter-in-place. Historically, some of the largest traffic spikes that are more visible in the lower overall-traffic states start to show dominance of gaming and some other over-the-top (OTT) services, which we’ll explore in future updates to this blog post.

Network Traffic in Washington
Finally, in the states we initially looked at, Washington has the most representation from end networks in our service provider index and also has shown the highest step functions of growth in traffic. This goes back to our earlier point that the more traffic there was before COVID-19, the less the percentage traffic growth will be, and in Washington’s case, vice versa.

As many service providers and digital enterprises work to adapt their services to be respectful of the access networks, we’ll be watching for the traffic effects on these networks, and over time, we’ll layer in performance data as well to compare it with the traffic trends.
Can the Internet Handle More Traffic?
At the current network traffic levels we’re observing, the internet overall is performing well. In our virtual panel yesterday with leaders from Zoom, Netflix, Dropbox, and Equinix, people expressed general contentment with capacity and quality across the network interconnection edge, both using up excess headroom that had been pre-provisioned and growing that capacity with the traffic increases over the last few months.
The panel’s take matches what we are hearing from our SaaS, content, and gaming customers: people are watching the supply chains, but generally are able to continue to add capacity to their own infrastructures and leverage the public cloud compute infrastructures to help scale their services.
With the current mix of business and consumer traffic growth, we may see continued caution in suggesting lower-bitrate defaults, but the current feeling in the networking community seems to be that things should hold.
If new macro issues surfaced that, say, directed large portions of those still consuming via cable and broadcast to internet-streaming properties, we could see different kinds of issues. However, so far, we have not seen a major ratio shift, and the eyeball network providers have long since enabled large content libraries to be delivered via set-top box.
The Kentik team will continue to monitor this issue and report back with findings as we have them. For more information on what we are looking at and why, please read the update below or reach out to us.
Updated on 3/6/20
Here at Kentik, we’re always interested in monitoring trends in network traffic. This helps to inform our community and our customers (i.e., enterprises globally, as well as service providers that make the internet and applications available to us all) about potential opportunities and threats to network operations. It is, after all, our mission to provide the analytics, insights and automation to make every network excellent.
When news of the coronavirus, COVID-19, began to pick up back in January, the team at Kentik wanted to examine what traffic trends might reveal about digital behaviors. Particularly in Asia, where the first infection was reported in China, as well as in North America, where Kentik is headquartered, we wanted to see if there were noticeable traffic spikes during typical, daytime 9-5 working hours. With reports that countries, municipalities, companies, and other organizations continue to put precautionary measures in place, such as work-from-home policies to avoid illness, we wanted to see if we might observe an increase in network traffic, specifically for common business applications like video conferencing and messaging services.
Here’s What We Saw
On a daily basis, network traffic spikes are typically observed in evening hours when people tend to be at home online. However, from late January (around the start of news of the coronavirus) to late February: Kentik saw a 200% increase in video conferencing traffic during 9-5 working hours in North America and Asia.
How Does Kentik Get This Data?
The Kentik Platform has the ability to apply application context to network traffic and can determine traffic volumes for specific applications. For example, we can distinguish between traffic types such as streaming video, video conferencing and video conferencing that includes messaging.
Why the Network Matters
When normal routines of workforces and society, in general, are disrupted, technology, applications and the networks that run them become more important than ever. Behind these critical technologies are the network operations teams, who are on the front lines and must ensure performance, reliability and availability.
The Kentik team will continue to monitor this issue and report back with more findings. For more information, reach out to us.


