Podcast with Kentik CEO Avi Freedman & Jim Metzler

Summary
Kentik recently launched Kentik NPM, a network performance monitoring solution for today’s digital business. Integrated into Kentik Detect, Kentik NPM addresses the visibility gaps left by legacy appliances, using lightweight software agents to gather performance metrics from real traffic. This podcast with Kentik CEO Avi Freedman explores Kentik NPM as a game-changer for performance monitoring.
Podcast with Kentik CEO Avi Freedman and analyst Jim Metzler
On September 20, Kentik announced Kentik NPM, the first network performance monitoring solution designed for the speed, scale, and architecture of today’s digital business. Addressing the visibility gaps left by legacy appliances in centralized data centers, Kentik NPM uses lightweight software agents to gather performance metrics from real traffic wherever application servers are distributed across the Internet. Performance data is correlated with NetFlow, BGP, and GeoIP data into a unified time series database in Kentik Detect, where it’s available in real time for monitoring, alerting, and silo-free analytics. In this podcast Kentik CEO Avi Freedman and Jim Metzler, VP at Ashton, Metzler & Associates, discuss Kentik NPM and how it fits into the overall performance monitoring market. Excerpts from the full podcast are presented below.
What is Kentik NPM?

Our Network Performance Management solution, Kentik NPM, sits on top of the Kentik Detect platform. We think that what’s been missing from the network analytics tool suites is an easy way for people to look at their actual traffic, and determine whether applications and users are affected. So anyone that runs applications over the Internet that have to do with revenue, or the continuity of the business, we think that those are the folks that should care about Kentik NPM.
Why we need another NPM solution, and why SaaS
What we’ve heard from our customers is that there’s no solution that they can consume the way they want. There are appliances, there’s downloadable software, but there’s been no SaaS option that gives them the basic network visibility that they want, with an understanding of their topology and how networks interconnect, but also gives them the context of what the performance of that traffic is. So what people want is SaaS, big-data based, open, and integratable with their tool suites, and they haven’t had options in the market.
To have a true network time machine, you need to keep all of your data, which makes it a big-data problem.
The main frustration that people had with a lot of the tool suites, especially on the NetFlow analytics side, which is where we started and spent the first couple of years of Kentik focusing on, is that most of the solutions take all the data in, aggregate it, and throw it away. So in order to really have a network time machine, you need to be able to keep all that data. But now you’ve got a really large big-data problem. Most of our users are storing billions, tens of billions, even hundreds of billions of records, and they don’t really want to fire up that much infrastructure and run that on-prem.
So SaaS is attractive for people that just want to have the data processed in the cloud and stored in the cloud without having to turn on that infrastructure. And for the people that really do want it to be on-prem, we do on-prem SaaS as well, and in that case it’s really that they don’t want to manage, they don’t want to develop, they don’t want to build their own network-savvy big-data solution. They just want a managed solution.
Why Kentik NPM uses a host agent
The basic component of the NPM solution is the core Kentik Detect offering, which takes everything from sFlow, NetFlow, and IPFIX to what we call “augmented flow data,” which has performance and security information in it, and makes that data available via SaaS portal, alerting system, and APIs. Most of our customers start with that, monitoring and sending us data from their existing network elements.
The NPM solution adds to Kentik Detect with data from an nProbe host agent or sensor.
The NPM solution adds to that by specifically taking data from a host agent, or a sensor. We’ve decided to use the nProbe technology from a company called ntop. Luca Deri has been running that project. It’s really the granddaddy, in some sense, of a lot of network monitoring. And that agent goes on a server, or on a sensor that can see copies of traffic, and then feeds us that data with not only the flow of the traffic but also the performance. And in some cases, the semantics of what the application is actually doing.
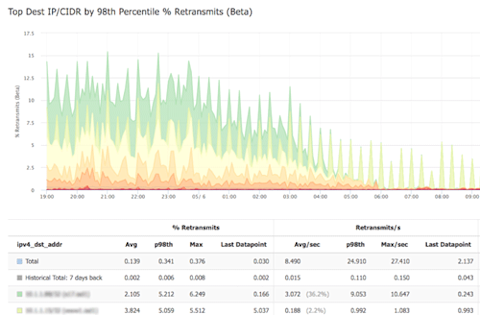
So that data goes in, and then the NPM elements of the Kentik Detect platform will let you actually look at the flow of the traffic colored by performance and see if there is a problem, and if so, where it is. Is it the network? Is it the WAN? Is it the Internet? Is it the data center? Or where in the application should I look?
So it’s Kentik Detect, with augmented flow coming from nProbe as the main sensor, serving up traffic from looking at pcap on servers or taps and spans.
The downside of NPM appliances
A lot of our customers write their own applications and control their entire infrastructure. And they are of the attitude that the last thing they want is to buy appliances. A lot of them are actually looking at White Box or running White Box, and they don’t even want to buy major brand switches and routers. Much less $300,000 appliances to go into the network.
The last thing a lot of our customers want is to buy appliances.
So the host agent gives them the flexibility to run on top of and integrated with all of their current application infrastructure, and to send the kind of data that they need to actually make decisions. We need an agent because most routers and switches, and firewalls and load balancers, don’t have the ability to report on the traffic that’s occurring with performance instrumentation. You can do it with a few different vendors, a few of their models, but there’s really no blanket way to do that.
The host agent is something that plays well with our big-data architecture, it’s easy to deploy, and doesn’t require any physical mucking around with packet brokers. Now, if they have packet brokers installed, then that same host agent could be run on a $3,000, 40-gig sensor if they want to. But in our world, an appliance is just a commodity, white-box server running the same host agent, and that’s another way to deploy.
How Kentik customers are using Kentik NPM
A vertical that we’ve had a lot of success in — that we actually developed a lot of this technology with — is Ad Tech. You’ve got a number of companies, all very technically sophisticated, who often actually need to cooperate with their competitors. And they all, as a group, have latency SLAs in the tens of milliseconds. So 50ms to do the complete transaction of putting an ad on a web page. Because that web page may have multiple ads.
The question that always comes up if they’re not meeting their SLA is why? Where’s the problem? It gets back to that age-old “is it the network?” question. And the main way that the Ad Tech folks are using Kentik’s NPM is to take a look at the performance and project it on top of the network flow, on top of their topology, and be able to see very clearly where the bottlenecks are, if there are any in the network, and then be able to drive action to do something about it.
We have customers that are automatically routing around Internet bottlenecks.
A very common thing is when there’s a problem with a network in the middle of the Internet that the traffic goes through to get to one of their trading partners. And then we actually have customers that are automatically influencing routing to route around those kinds of bottlenecks. So it’s detect, decide what to do, react, and sometimes automate it.
The other big category is what we call SaaS companies. That’s sort of a subset of the web-company vertical. SaaS companies all believe in customer success and customer experience, and their revenue is almost always going over the Internet. So again, they need to be able to quickly determine when there’s a user complaint, or ideally proactively that there’s an issue but it isn’t with the network, or there’s an issue and it’s with this part of the network, so let’s go do something about it.
And those are decisions and really observations that they can’t make without performance data, which you can’t really get from the routers and switches that they run in their infrastructure.
How Kentik NPM helps ISPs and hosting companies
The hosting companies and ISPs — we call them service providers — are the people that make the Internet, as opposed to the people that use the Internet. Their interest is in knowing about issues before customers are calling their NOC, really understanding what the performance is, and then, again, doing something about it. They’re typically very well-connected, have provisioning systems, and can signal their infrastructure.
Companies that don’t have control of the hosts will deploy the agent in a sensor mode.
But what’s been missing is actually an understanding of what’s going on. Now, for most of those companies, they don’t have control of the hosts. So they’ll deploy the agent in a sensor mode where it’s on top of a $3,000 machine seeing copies of the traffic. And typically they’ll focus on the outside of the network, and be looking at where they’re having performance problems in their peers and upstream providers.
And their goal is not as much to maximize revenue that’s going inside the packets that are their application. Their goal is to increase customer satisfaction, and in some cases just have the data so that when someone reports an issue, they can go and look at it and have an intelligent conversation.
How Kentik NPM applies to enterprises
Kentik’s NPM is used by enterprise very similarly to the way that SaaS companies use us. Which is, the parts of the network, and specifically the traffic, that makes revenue — the marketing web site, the APIs, which allow the business to go, to place orders and to make orders, and is part of their digital supply chain — that’s typically the area of traffic that they start focusing on. To be able to see what to do to keep traffic flowing well. To be able to proactively know where there are problems, tag that back to what application or users are affected, and to be able to deal with it.
For enterprise users it’s largely about providing great service to the rest of the company.
I’d say secondarily, a lot of enterprise, even the ones using SDWAN, are themselves service providers to their internal customers. So we’re talking more about the Fortune 1,000 in this case, that have global networks. And in that case, it’s less about optimizing revenue like the network-operator folks, and more about just providing great service to the rest of the company. We’re targeting the larger companies that either make revenue over the Internet or that have internal users, typically pretty broadly deployed, and have a service-provider-like outlook towards them.
Kentik NPM cost
We charge as an annual contract with a fee for each router, switch, and host. The host monitoring is typically a lot lower cost per host than any other approach. It depends a little bit on the volume, and how much people want to store. But we have customers that are monitoring hundreds of hosts, and tell us that it’s much more economical than either than building it themselves, which is what they had been trying to do, or running the big data platforms, or using the appliance and downloadable software solutions we talked about.
Trying Kentik NPM
People can just sign up for a free trial directly on our website, at www.kentik.com, and actually get into trial on their own. Just download the agent, install, and start sending flow. If someone does sign up, we’re going to immediately contact and offer our assistance, but a lot of our customers don’t want to be bugged. They just want to go try it. So we’re fine with that. Typically people can be up and running in a matter of minutes with data from the routers and switches, depending on their config management system. It might be 15 minutes to a couple of hours to push something into a docker build, or however they deploy software onto hosts.
People can sign up for a free trial, download the agent, install, and start sending flow.
Anyone can sign up for the trial, including our competitors — we see them doing that fairly often. And you can just start adding devices. We have an extensive knowledge base, so many people can do that themselves. That just starts a 30-day trial. Again, people can do that entirely autonomously, or we’re happy to jump in and help try to understand the use cases, especially once data is flowing, to walk through how Kentik Detect and the NPM components can solve the issues that they’re seeing. And especially talk with them about how it integrates with their metrics, databases, and their APM tools. So typically it’s a 30-day free trial. And then we extend it for some larger customers, or if we need to prove an integration, or add a connector for a certain type of device that they have.
Want to learn more about the industry’s only purpose-built Big Data SaaS for network traffic analysis? See for yourself what you can do with Kentik by signing up for a free trial. And if you’re inspired to get involved, we’re hiring!


