RouterFreak on Kentik Network Performance Monitoring

Summary
Earlier this year the folks over at RouterFreak did a very thorough review of Kentik Detect. We really respected their thoroughness and the fact that they are practicing network engineers, so as we’ve come up with cool new gizmos in our product, we’ve asked them to extend their review. This post highlights some excerpts from their latest review, with particular focus on Kentik NPM, our enhanced network performance monitoring solution.
Excerpts from an in-depth look at Kentik Detect

Earlier this year the folks over at RouterFreak did a very thorough review of Kentik Detect. We really respected their thoroughness and the fact that they are practicing network engineers, so as we’ve come up with cool new gizmos in our product, we’ve asked them to extend their review. Following here, from their latest review, are some excerpts that focus on Kentik NPM, our enhanced network performance monitoring solution.
Recently we reviewed Kentik Detect, a very customizable, flexible and scalable cloud based NetFlow collector. Today we’ll be reviewing Kentik’s Network Performance Monitor (NPM) solution, which offers a new host monitoring agent in conjunction with Kentik Direct and gives users an even deeper level of network visibility.
What is Network Performance Monitoring (NPM)?
Kentik’s NPM solution goes beyond typical NetFlow traffic analysis in that it is enabled through the installation of an nProbe application on Linux based servers. The probe captures packets from sampled flows of live, incoming and outgoing traffic and sends that information to Kentik Direct in IPFIX packets.
What’s the benefit of this you ask? Well, as the probe is installed on the server itself, it is privy to information which NetFlow devices are not.
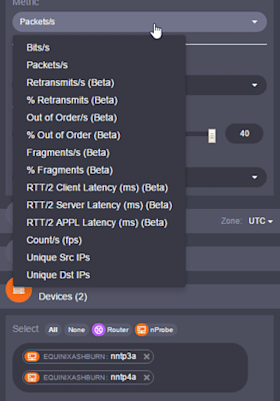
As per Kentik’s nProbe documentation, hosts which have the probe installed generate four additional metrics that are sent to the Kentik Detect back-end:
- Retransmits per second and %
- Out-of-order packets per second and %
- Fragments per second and %
- Network latency per client/server/application (ms)
Further to this, the metrics are seamlessly added to the Data Explorer if the selected device(s) have the probe installed. For example, as per the image below, when I select the two “nntp” hosts and then click on the “Metric” dropdown menu, I’m provided with the standard metrics as well as the additional augmented metrics.
On the other hand, if I select hosts which do not have the probe installed, these metrics are not displayed. Sure it’s a little feature, but it’s nice nevertheless as it avoids the need to memorize which hosts can and which cannot use these metrics.
Do I Need the Additional Visibility?
Yes! Here are just some of the issues you can identify using the augmented metrics:
- Retransmits per second and %: If your clients and/or servers are retransmitting packets regularly it could be due to congestion. If this is the case, the retransmits will amplify the issue.
- Out-of-order packets per second and %: Suboptimal use of redundant delivery paths. Reordering packets wastes resources and should be avoided.
- Fragments per second and %: A device in the delivery path has a lower than expected MTU. This issue should be rectified because:
- Fragmented packets are often dropped by intermediate devices and firewalls.
- Reconstructing fragmented packets wastes resources.
- Applications often send their traffic with the DF bit set. As a result of this, this traffic will be dropped. - Network latency per client/server/application (ms): Slow performance is often blamed on the network, whether it be the client or server side. However, it’s just as possible the actual application itself who is at fault. This metric will allow you to identify where the latency is being introduced.
Test Drive
Let’s take a look at how we can use the “% Retransmits” metric to see how we can gain a deeper understanding of what is causing packet loss in a network.
With the metric selected, along with the “Destination IP/CIDR” dimension, our graph looks like this:
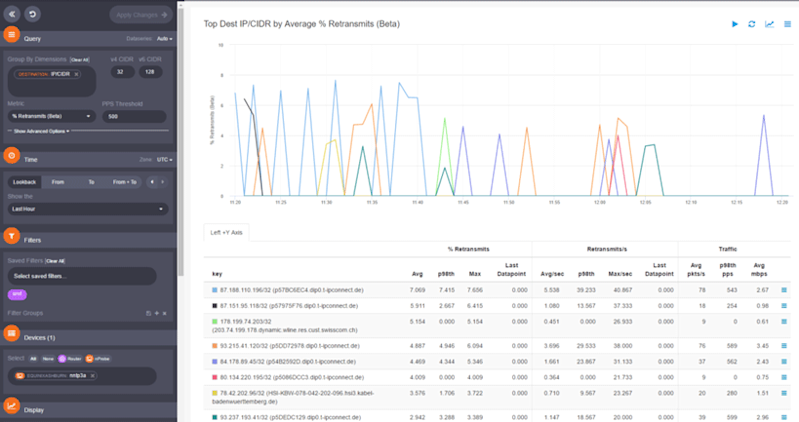
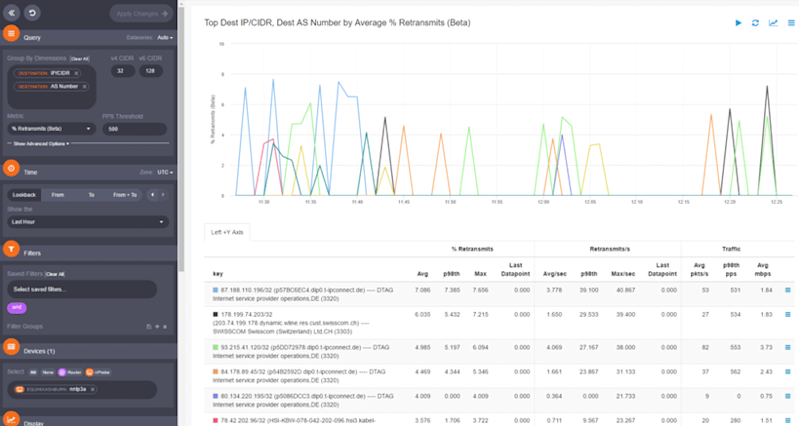
What we see here is the percentage of retransmits to specific servers. This is a great start though this information doesn’t tell us which application(s) are experiencing the retransmissions. Adding the “Destination Port” dimension provides us with that visibility:
But now let’s say that we no longer think the issue is specific server or service related. What could we do if we thought the issue was path related? We could remove both the “Destination Port” and “Destination IP/CIDR” dimensions and replace them with “Destination AS Number”. What this does is it gives us an AS level view of where packets are being retransmitted:
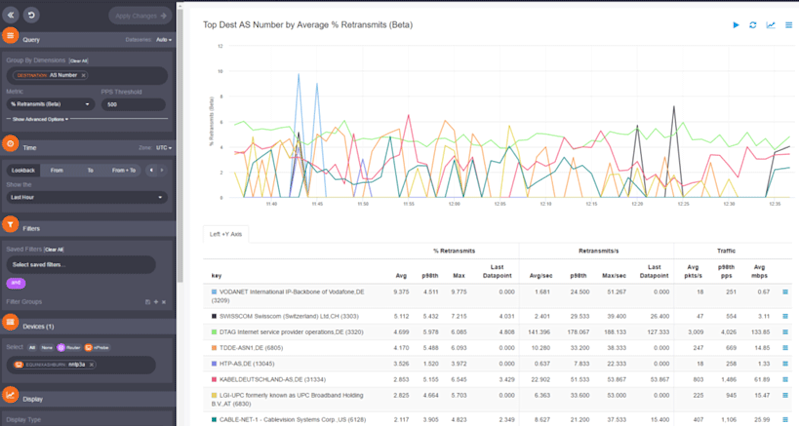
As we’ve just seen, using these augmented metrics in conjunction with the preexisting dimensions provides us with new levels of visibility which were not available to us previously.
Router Freak’s Verdict
The nProbe agent adds more features to an already fantastic product. Kentik Detect does a great job of providing traffic visibility, but the nProbe agent takes it to a whole new level.
While performing packet captures at multiple points in your network is a great idea when you’re troubleshooting an issue, it can be very time-consuming. Further to this, you need to ensure your captures are running before the issue occurs again in order to be able to analyze the data. On the other hand, as the nProbe agents are collecting data before, during and after the issue, you’re able to start your analysis immediately.
What we really liked is that nProbe is much more that a simple NetFlow probe. NetFlow is the de-facto standard for network traffic accounting, but nProbe includes both a NetFlow v5/v9/IPFIX probe and packet capture (pcap) function that can be used to increase the available metrics.
Another great feature of nProbe is the availability for Linux, Windows and embedded system such as ARM and MIPS/MIPSEL.
The supported layer-7 applications are more than 250, including the most popular Skype and BitTorrent. Last but not least, both IPv4 and IPv6 are available.
All in all it’s a great feature and I really can’t think of a reason why you wouldn’t want it running on your servers.
To read the whole review including further walk throughs of real-world examples, go to www.routerfreak.com. If you want to learn more about Kentik NPM, check out our performance monitoring solution page. If you’d like to get cloud-friendly network performance monitoring today, start a free trial or hit us up and we can walk you through a demo.
