The Why and How of Interface Classification

Summary
Kentik addresses the day-to-day challenges of network operations, but our unique big network data platform also generates valuable business insights. A great example of this duality is our new Interface Classification feature, which streamlines an otherwise-tedious technical task while also giving sales teams a real competitive advantage. In this post we look at what it can do, how we’ve implemented it, and how to get started.
Classifying Network Interfaces Enhances Engineering and Business Insights
Given that Kentik was founded primarily by network engineers, it’s easy to think of our raison d’etre in terms of addressing the day-to-day challenges of network operations. While that’s a key aspect of our mission, our unique big data platform for capturing, unifying, and analyzing network data actually supports a broader scope. Kentik Detect is built to generate valuable insights not only from the technical perspective but also for business intelligence. A great example of this duality is a feature called
Interface Classification (IC) that we recently introduced to our portal. IC spares technical teams by streamlining an otherwise-tedious task, but it also exposes information that provides sales teams with real competitive advantage. In this post we’ll look at several aspects of this new capability, including the technical and business problems it solves, the database dimensions we’ve added to enable it, and how to get started using it. In a future post we’ll take a closer look at some typical use cases.
Keeping Counts Real
From a technical standpoint, Interface Classification provides an elegant solution to a critical question of flow-based analytics: how do we uniquely identify flows when they may pass through multiple interfaces within our autonomous system (AS)? We know that flows are a set of packets that share common attributes including protocol, source and destination IP, and src, dst, and next-hop AS. The problem arises because flow records (NetFlow, sFlow, IPFIX, etc.) are generated by individual routers, switches, and hosts rather than system wide. So unless the records generated at various points can be correlated, a given flow may be counted as multiple flows, throwing off the count.
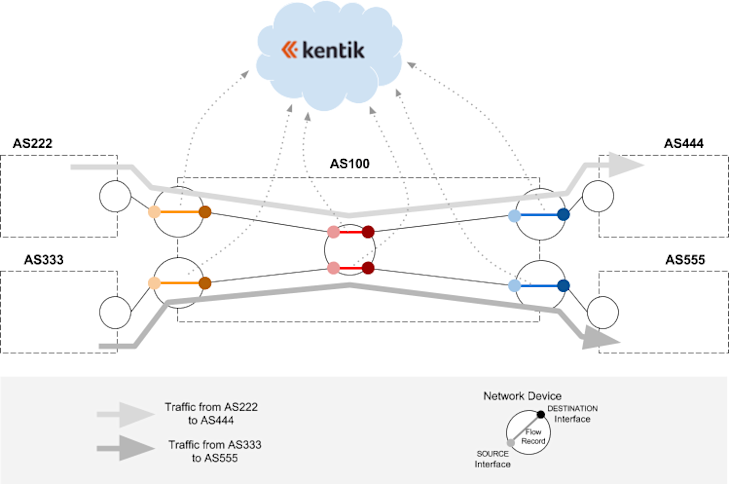
In the example diagrammed above, AS100 is an imaginary Kentik Detect customer that receives and sends traffic to multiple ASNs via five network devices. We have only two traffic flows (the light and dark gray lines), but each flow is generating three flow records that are sent to Kentik Detect: at ingress (orange segments at left), at every internal network element (red segments in center), and at egress (blue segments at right). If we want to count flows at ingress then we need to be able to exclude the flow records that aren’t from the two orange segments at the left. Likewise, if we want to count the flows at egress we need to be able to exclude the flow records that aren’t from the two blue segments at the right.
The multiple-count issue has (naturally) been anticipated in Kentik Detect from the outset. The flow metadata stored in the Kentik Data Engine (our backend) isn’t simply what comes to us from network devices; instead it is enhanced with a variety of derived or externally acquired information (e.g. BGP, GeoIP, SNMP, etc.) that makes it possible to minimize double-counting. For example you can manually select the devices included in a query, or use filters based on device names (e.g. names containing “EDGE”) or manually-entered interface descriptions. You can even use Saved Filters to avoid having to recreate the necessary filters for each query.
The downside of these approaches is that they place a hurdle that users have to jump when they are trying to get information. And unfortunately they aren’t completely foolproof because the user has no way of knowing if the fields being filtered are consistent (does everybody in the organization use the exact same label strings?) or accurate (have descriptions been updated when interfaces are repurposed?).
Interface Classification addresses the above issues by introducing the concept of Network Boundary, which allows any interface in a Kentik Detect user’s network to be characterized in one of two ways:
- Internal: Connects the network device to which it belongs with an interface on another device within the same ASN. This could be a backbone interface, or an interface towards a server inside the network.
- External: Connects the network device to which it belongs with an interface on a device in a different ASN, which might belong to a transit provider or a peer.
Kentik Detect keeps a device database for information about each device (and its interfaces) that your organization registers with the system. When traffic crosses a device, we can derive from the device-generated flow records (e.g. NetFlow) which interfaces it passed through, look up those interfaces in the device database, and incorporate attribute values from that database into the flow records that we store in the Kentik Data engine (KDE). To implement Network Boundary we’ve augmented the device database with a network boundary attribute, which enables the following:
- Each interface on each device can now be classified with its Network Boundary value (Internal or External).
- Each flow record stored in KDE can now include the Network Boundary value for its source and destination interfaces.
Assuming that the interfaces themselves have been correctly classified (we’ll get to this later), if we now filter on a given combination of source and destination network boundary values, as shown in the table below, we can easily zero in only on traffic with the directionality that we want to query, and avoid seeing the same flow counted multiple times.
| Network Boundary | SOURCE = Internal | SOURCE = External |
| DESTINATION = Internal | Internal traffic: The flow represents traffic that is circulating inside the network from router to router or from router to host. | Inbound traffic: The flow represents ingress traffic from a peer, transit provider, Internet Exchange, etc. |
| DESTINATION = External | Outbound traffic: The flow represents egress traffic from your network to another network. | Hot-potato Traffic: The flow represents traffic that goes directly from a peer to a peer without ever crossing your backbone. |
What Does My Traffic Cost?
Now that we have a sense of Interface Classification from the engineering perspective, let’s dig into the business side. Needless to say, you can’t make a profit moving traffic unless you sell your services for more than your cost. So to optimize pricing you need to know the end-to-end ROI of traffic coming from a given network, transiting through your own network, and exiting at multiple locations in different volumes. You also need to be able to slice traffic by categories of connectivity: transit, Internet Exchange peering, direct peering (free or paid), long distance backbone, metropolitan backbone, etc. That information isn’t included in any flow protocol, which has made rational pricing surprisingly difficult to determine. As with the flow-counting issue, Kentik Detect’s powerful filtering capabilities can get you a long way toward the info you need. That’s because networking best practices — if consistently adhered to — give you a couple of ways to try to figure out what’s what:
- Interface description: Most decent size networks largely follow (more or less) consistent naming conventions, and those names are one of the first attributes looked at when troubleshooting, so there’s usually a strong incentive to keep them up to date. If an organization has SNMP polling enabled on all of its network devices, descriptions are readily available and pulled by Kentik Detect.
- Interface IP address: Depending on a network’s addressing policies, connectivity type can be inferred from the IP Addressing on the interface, which is polled by Kentik Detect. Examples of policies might include: - a range of IP addresses may be used exclusively for transit customers; - a range of RFC1918 IP addresses may be used exclusively for interfaces on CDN servers behind a load balancer; - a range may correspond to the LAN of a particular Internet Exchange.
The two methods above enable us to take the same approach to connectivity typing that we took with network boundary. In other words we created attributes for the Connectivity Type of interfaces, and we can assign connectivity type values for both source and destination interfaces to flows as they are ingested into KDE. That makes it much easier to include connectivity type as a factor in a query, so you can look at the type of network from which a given set of traffic is entering and to which it is going. Here’s the list of connectivity types that we are supporting in our initial release:
- Transit
- IX Peering (Fabric)
- Free private peering
- Paid private peering
- Backbone
- Customer
- Host
- Available (identifies an interface that is available and unused versus one that isn’t available, e.g., no transceiver).
- Reserved (identifies an interface that is currently available but already allocated for future use).
Interface Classification Rules!
So far we’ve looked at the challenges that Interface Classification addresses and the attributes whose values can now be incorporated directly into KDE flow records. But these attributes only help us if attribute values have been accurately and consistently assigned to the interfaces themselves. That’s a big hurdle, because some networks have multiple thousands or tens of thousands of interfaces to classify. And it’s not a one-time job, because interfaces are added or decommissioned every day, rendering manual classification nearly impossible to keep consistent. So we need a practical way to automate the initial classification and then keep it up to date. That brings us to the real fun, which is our new Interface Classification rules engine.
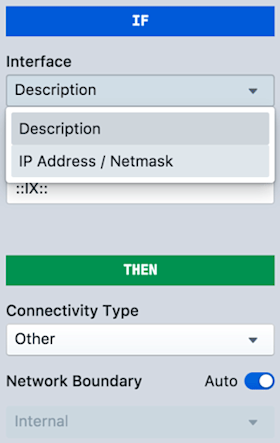
The rules engine, accessed in the portal via Admin » Interface Classification, looks periodically at the SNMP attributes gathered from the interfaces that you’ve registered with Kentik Detect, and it evaluates those attributes using a limited set of user-configurable “if-match-then-classify” rules. These rules are defined in the editing pane of the Add Rule dialog (image at right), which you reach via the green Add Rule button.
The “If” section tells the rules engine what condition to match, while the “Then” section enables you to define the corresponding Connectivity Type. By default, the Network Boundary is automatically determined by the Connectivity Type. You can change the automatic correspondence between the two attributes (click the Configure Network Boundaries link on the main IC page), or you can toggle Auto to off, then manually set the boundary that will be applied for an individual rule.
These settings allow us to build rules in a couple of different ways:
- Base the rule on interface description, which might be stated as something like “if description contains peering: PI then classify the interface as free private peering.” In this case “peering: PI” would be a string that you provide based on your knowledge of the interface description protocol used on your network, and free private peering would be selected from the connectivity type drop-down.
- Base the rule on IP, which might be stated as “if IP address is in subnet 123.456.78.90 then classify the interface as host.”
The following table gives an idea of the types of matching you can currently use in your rules:
| Interface Attribute | Match clause | Matches when... |
| Description | Equals | Provided string is an exact match with the description (case sensitive). |
| Description | Contains | Provided string is found in the description (case insensitive). |
| Description | Matches Regex | Provided string is found in the description with Standard Regex match. |
| IP Address | is contained in subnet | Interface's IP address is within the user-provided CIDR. |
| IP Address | is a Public IP Address | Interface's IP address is a publicly routable IP address. |
| IP Address | is a Private IP Address | Interface's IP address is reserved (e.g. RFC1918, test-net, doc-net, apipa, cgn, etc.). |
| IP Address | has no IP address | Interface has no IP address. |
The Interface Classification UI gives you the ability to test rules before they are actually applied so that you know how many (and which) interfaces would be classified by the rule. Once you are happy with a rule you save it to the rules list (shown in the screenshot below). In most cases you’ll define multiple rules, which can be reordered in the list as desired (as well as disabled or deleted).
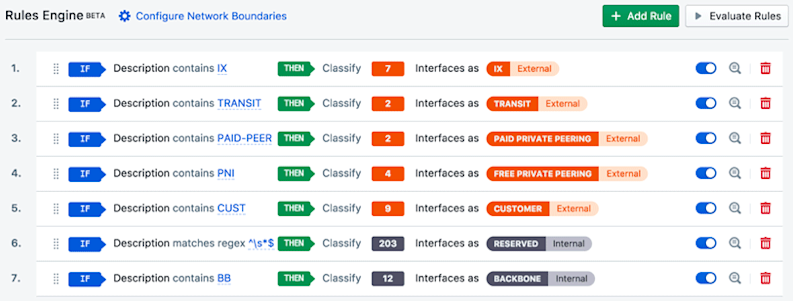
When you click the Evaluate Rules button (upper right) the engine works through the interfaces on all of your registered devices. Classification is applied based on the first (top-most) match condition (“if”) that results in a match. When an interface is classified, the values of the two attributes (connectivity type and network boundary) are written to your organization’s devices database in Kentik Detect, which is updated every three hours. From there the values are applied to incoming flow records as they are processed by our ingest layer.
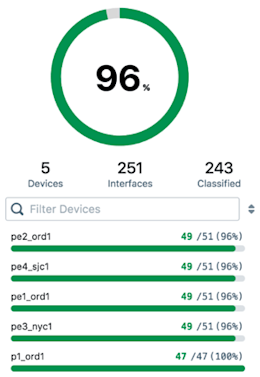
If no rule is matched for a given interface, that interface won’t be classified. The percent of your interfaces that were successfully classified is shown (see image at right) as part of the Classified Interfaces pane of the Interface Classification page. The pane also provides a list of devices that have unclassified interfaces. High classification ratios are usually achieved by using a rigorously consistent interface description naming system and IP addressing system across your entire infrastructure. Now that we understand what Interface Classification is we can look at various scenarios to see how you can use it when querying your network data in Kentik Detect. We’ll get to that in the next post in this series. In the meantime, for more details see the Interface Classification article in the Kentik Knowledge Base. You can also familiarize yourself with Kentik in general, and Interface Classification in particular, by scheduling a demo or signing up for a free trial today.

