Troubleshooting Cloud Application Performance: A Guide to Effective Cloud Monitoring


Summary
The scalability, flexibility, and cost-effectiveness of cloud-based applications are well known, but they’re not immune to performance issues. We’ve got some of the best practices for ensuring effective application performance in the cloud.
Cloud-based applications offer unparalleled benefits in terms of scalability, flexibility, and cost-effectiveness. However, these applications are not immune to performance issues. Like any other software, your cloud applications may experience misconfiguration problems, traffic congestion, or other issues that can affect the overall user experience. It’s essential that you can troubleshoot application activity in the cloud to ensure effective performance.
Unfortunately, troubleshooting can be challenging due to the complexity of cloud architectures and the myriad tech stacks involved. That’s why this article will discuss some best practices for troubleshooting cloud apps. This includes things such as identifying misconfigurations and declined or dropped flows, as well as congestion in east-west and cloud-to-site connections.
After reading this article, you’ll have learned about several practical ways to fix performance problems in cloud applications. This includes finding misconfigurations, understanding network traffic, using distributed tracing mechanisms, and using synthetic testing.
Why you should troubleshoot cloud application performance
Modern cloud applications consist of various microservices, infrastructures, languages, and frameworks. Their distributed nature introduces multiple points of potential failure. Without a proper governance framework, these complexities can quickly disrupt availability and create performance issues stemming from underlying problems.
Organizations need effective observability solutions that provide a holistic view of the application and its components, offering operational teams much-needed visibility. By troubleshooting cloud applications, these organizations can detect and rectify issues before they escalate into full-fledged problems. Employing effective troubleshooting practices enables the early detection of performance issues and ensures compliance with service level agreements (SLAs).
The benefits of troubleshooting cloud applications are numerous. It enhances user experience, reduces unnecessary costs, and strengthens the security of your services. Adopting effective troubleshooting practices is essential for enterprises aiming to stay ahead in a competitive industry.
Best practices for troubleshooting cloud application performance issues
Because of the complexity of cloud applications, identifying and resolving performance issues can be complicated. Whether dealing with complex application configurations or network latency, knowing how to diagnose and troubleshoot issues can be the key to maintaining optimal performance.
The following sections will outline some practical strategies for resolving performance issues in cloud applications.
Implement log aggregation
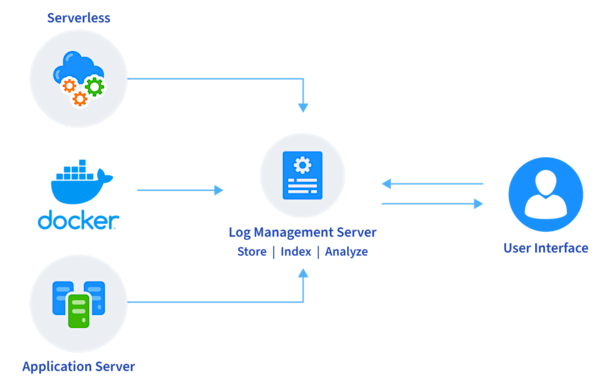
Logs play a crucial role in troubleshooting your cloud applications for performance issues. Log aggregation, the practice of collecting logs from various sources and consolidating them into a unified platform, is a powerful tool in this process. Each component in your cloud architecture exposes logs that provide detailed information about its status and behavior at any given point in time.
Application logs generated from call stacks and runtime libraries, such as Log4j, help determine application behavior at runtime. System logs emitted from firewalls, servers, object storage buckets, and Syslog provide security insights:

Examples of these types of log telemetry data are VPC Flow Logs that capture information about the IP traffic going to and from network interfaces in your VPC, or NetFlow, a network protocol for collecting IP traffic information and monitoring network flow.
Logs are also generated for network resources, databases, and serverless functions. These amount to massive data and can be hard to navigate without proper tools and frameworks. Log aggregation simplifies this process and helps correlate events and find patterns that might be hard to catch when looking at logs in isolation.
For example, log aggregation can quickly reveal if a performance issue is caused by a particular service’s increased latency, possibly due to the problematic interaction between two microservices.
Use a centralized configuration management solution
In a complex, distributed cloud environment, settings are often scattered across services and components. This practice can quickly lead to misconfigurations and cause serious performance issues or service disruptions.
A centralized configuration management solution, such as Spring Cloud Config or HashiCorp Consul, can help manage these configurations by collecting all of them into one unified platform. These platforms are designed to keep your configuration settings in one location that’s easy to manage and visualize. Additionally, such systems allow for consistent configurations across your environment, minimizing discrepancies that can cause performance problems.
While centralized configuration management solutions help maintain and manage configurations, automation tools, such as Ansible, Chef, and Puppet, can be employed for dynamic configuration changes. Although these tools aren’t primarily focused on configuration management, they can be effectively utilized with proper GitOps practices.
By combining centralized configuration management solutions and automation tools, operations teams can maintain a consistent, efficient, and robust environment. This helps to reduce the risk of misconfigurations, improve system resilience, and ultimately boost the performance of cloud applications.
Diagnose network traffic
When troubleshooting cloud application performance, understanding network traffic behavior is critical. Network congestion can significantly impact application performance, particularly in east-west (i.e., traffic between servers in the same data center) and cloud-to-site connections. Implementing effective network traffic diagnosis is essential to mitigate these issues, and using appropriate network diagnosis tools can make this task more manageable.
Choosing a network observability platform that provides real-time visibility into network traffic is ideal. The tool should be able to capture network data and enrich it with application and business context, delivering actionable insights for operations teams. This enables rapid identification of network congestion and its root cause, which may be due to sudden spikes in demand, distributed denial-of-service (DDoS) attacks, or misconfigurations.
The key to maintaining optimal application performance is understanding the flow and behavior of network traffic, including detecting network congestion points. Network observability tools can help simplify this task by providing real-time insights, enabling operations teams to rapidly identify and address potential network issues.
Regardless of the tool you use, the objective remains the same—ensure seamless network operations for efficient cloud application performance.
Add health endpoints
Another crucial practice when troubleshooting cloud application performance is adding health endpoints to your applications. Health endpoints are specific URIs in your application that return the status of different aspects of your app, such as database connectivity, memory usage, and uptime. This information is helpful for checking the health of your application and its components.
You can readily integrate health checks into monitoring tools to get real-time health updates and alerts in case of failures or performance degradation. By monitoring these endpoints, you can detect issues early and take remedial action before they escalate into major problems.
In a distributed cloud environment, health endpoints on each service can enable operations teams to keep a pulse on the overall system.
Use distributed tracing mechanisms
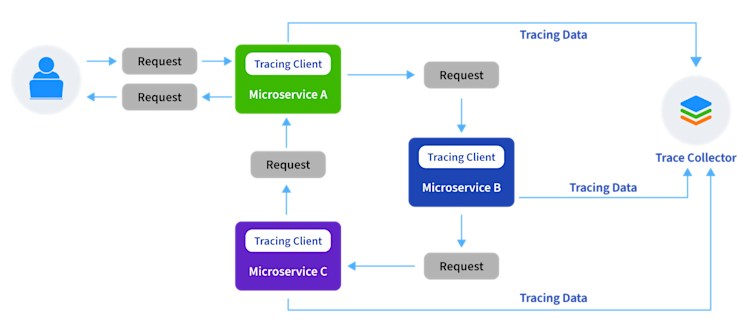
Another effective troubleshooting strategy for cloud application performance is using distributed tracing mechanisms. Distributed tracing tracks and monitors requests as they flow through various microservices and components of your application:

By implementing distributed tracing, you gain valuable insights into how requests are processed across different services. Each request is assigned a unique identifier, and as it travels through the application, the tracing mechanism captures information about its journey, including processing times and any errors encountered along the way.
With distributed tracing, you can identify bottlenecks and pinpoint the exact services or components causing performance issues. For example, if a user experiences slow response times, distributed tracing can help you trace the request flow and identify the specific microservice responsible for the delay.
Use a service mesh
A service mesh is an exclusive infrastructure layer that facilitates service-to-service communications in a microservice-based architecture. By doing so, it decouples the networking code from application logic, making it possible to update or change the network layer of your cloud application independently. It helps manage traffic flow, enforce policies, and offer valuable observability features.
Using a service mesh can help simplify the diagnosis and resolution of performance issues in the cloud as it provides insight into the complex interactions between microservices, making it easier to identify problematic patterns. Features such as traffic control and load balancing further enhance application performance.
Moreover, service mesh solutions such as Istio or Linkerd offer built-in observability features, providing metrics, logs, and traces necessary for comprehensive troubleshooting. Implementing one such solution can help you manage the communication layer of your cloud apps more proactively and avoid many potential performance issues.
Implement synthetic testing
Synthetic tests are simulated scenarios that mimic user behavior or interactions with an application. They’re specifically valuable for troubleshooting cloud application performance, as they help identify potential bottlenecks and issues before end users encounter them. Additionally, they can help reduce mean-time-to-resolution (MTTR) and uphold SLAs and product launches in new regions.
Synthetic tests encompass various testing types, including load, stress, and latency. These tests allow you to monitor performance under different conditions and configurations. By doing so, operations teams can detect issues and anomalies that might degrade application performance in the future.
Kentik: Your powerful ally for troubleshooting cloud applications
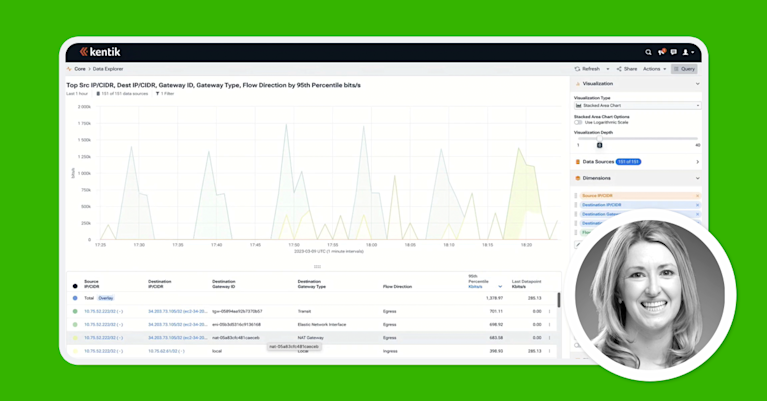
Kentik is a leading network observability solution that provides real-time visibility into your cloud applications’ network traffic, performance, and security. Its robust data analysis platform makes collecting and analyzing network data from various sources easy. It gives actionable insights so NetOps teams can proactively detect and diagnose performance problems.
Organizations can use Kentik’s network observability platform to implement digital experience monitoring, increase visibility into network traffic, and improve application performance testing. By integrating Kentik into your cloud troubleshooting process, you can enjoy the benefits of data-driven insights, allowing you to stay ahead of issues and ensure optimal application performance.
Conclusion
The distributed architecture of modern cloud applications makes it hard to troubleshoot performance issues. However, effective cloud troubleshooting can help mitigate these issues, reduce operational costs, and provide better security.
This article highlighted vital strategies to mitigate performance issues, including implementing log aggregation and centralized configuration management, adding health endpoints, and leveraging robust tools such as Kentik. Combined, these strategies result in a powerful framework for troubleshooting cloud application performance issues, ensuring your applications are always reliable, secure, and performant.
Check out Kentik Cloud to learn more about increasing your application’s performance. Discover the benefits of the Kentik Network Observability Platform for yourself — start a free trial or request a personalized demo today.


