Unlocking Network Insights: Bringing Context to Cloud Visibility


Summary
In today’s complex cloud environments, traditional network visibility tools fail to provide the necessary context to understand and troubleshoot application performance issues. In this post, we delve into how network observability bridges this gap by combining diverse telemetry data and enriching it with contextual information.
Years ago, the network consisted of a bare metal server down the hall, a few ethernet cables, an unmanaged switch, and the computer sitting on your desk. We could almost literally see how an uptick in interface errors on a specific port directly affected application performance.
Today, things have become just a little more complex (understatement of the year). Tracking down the cause of a problem could mean looking at firewall logs, pouring over Syslog messages, calling service providers, scrolling through page after page of AWS VPC flow logs, untangling SD-WAN policies, and googling what an ENI even is in the first place.
What we care about, though, isn’t really the interface stat, the flow log, the cloud metric, the Syslog message, or whatever telemetry you’re looking at. Yes, we care about it, but only because it helps us figure out and understand why our application is slow or why VoIP calls are choppy.
What we care about is almost always an application or a service. That’s the whole point of this system, and that, my friends, is the context for all the telemetry we ingest and analyze.
Traditional visibility is lacking
The problem with traditional network operations is that in the old days, visibility tools focused on only one form of telemetry at a time, leaving us to piece together how a flow log, an interface stat, a config change, a routing update, and everything else all fit together. However, traditional visibility was missing the context, or in other words, it lacked a method to connect all of that telemetry programmatically under what we actually cared about – the application.
I remember spending hours in the evening pouring over logs, metrics, and device configs, trying to figure out why users were experiencing application performance problems. And in the end, I usually figured it out. But it took hours or days, a small team of experts, and too many WebEx calls.
That may have worked in the days when most applications we used lived on our local computers, but today, almost all the apps I use daily are some form of SaaS running over the internet.
Traditional visibility methods just don’t work in the cloud era.
Network observability adds context to the cloud
Network observability has emerged in recent years as a new and critical discipline among engineers, and it’s all about adding context to the vast volume and variety of data ingested from various parts of the network.
Understanding a modern application’s behavior requires more than just surface-level metrics. Because the network has grown in scope, it demands a significant variety and volume of data to capture the nuances of its interactions within the system accurately.
This is a big difference between legacy visibility and network observability. Legacy visibility tools tend to be point solutions that are missing context, whereas network observability is interested in analyzing the various types of telemetry together.
For example, interface errors on a single router could hose app performance for an entire geographic region. However, finding that root cause is incredibly difficult when application delivery relies on many moving parts.
Instead, we can tie disparate telemetry data points together in one system with an application tag or label so we can filter more productively. Instead of querying for a metric or device we think could be the issue, we can query for an application and see everything related to it in one place. This dramatically reduces clue-chaining and, therefore, our mean time to resolution.
This means network observability looks at visibility more as a data analysis endeavor than simply the practice of ingesting metrics and putting them on colorful graphs. Under the hood, there’s much more going on than merely pulling in and presenting data. There’s programmatic data analysis to add the context we need and derive meaning from the telemetry we collect.
How does network observability add context?
Network observability starts with ingesting a significant volume and variety of telemetry from anything involved with application delivery. Then, that data is processed to ensure accuracy, to find outliers, to discover patterns, and organized into groups.
Organizing data can take many forms, and for those with a math background, it could conjure thoughts of clustering algorithms, linear regression, time series models, and so on. Additional technical and business metadata is added to enrich the dataset during this process. Often, this is labeled but not quantitative data: an application ID, a customer name, a container pod name, a project identifier, a geographic region, etc.
With an enriched and labeled dataset, we can know which metric is tied to which application, at what time, in which VPC, going over which Transit Gateway, and so on. In practice, the various telemetry will often relate to many activities and not just one application flow; network observability ties data points together to understand how the network impacts specific application delivery.
Kentik puts context into the cloud
Kentik ingests information from many sources into one system. Then, each Kentik customer has a database of network telemetry that’s cleaned, transformed, normalized, and enriched with contextually relevant data from their business and third-party data, such as cloud provider metrics and the global routing table itself.
Remember that working with the Kentik portal means you have all of that data in one place at your fingertips. Filtering for telemetry related to an application can get you data from the relevant cloud providers, network devices, security appliances, and so on, all in a single query. To get more precise, that query can be refined to see specific metrics like dropped packets, network latency, page load times, or anything else that’s important to you.
And really, that’s the core of Kentik. Whether you’re a network engineer, SRE, or cloud engineer, the data is all there and fast and easy to explore. Start with what matters to you – perhaps an application tag – and start filtering based on that.
Cloud optimization is crucial to delivering software with lean infrastructure operating margins and enhanced customer experiences.

A programmatic approach to network observability
However, Kentik also approaches network observability programmatically. Since the data is stored in a single unified data repository, we can do exciting things with it. For example, straightforward ML algorithms can be applied to identify deviations from standard patterns or, in other words, detect anomalies.
That’s not necessarily groundbreaking, especially because some anomalies are irrelevant if they occur just once and don’t impact anything. However, since we can put this into context, we know our line of business app performs poorly once latency on a particular link goes over 50ms, for example. Over time, even if latency never hits 50ms, throwing an alert, Kentik can still see the trend ticking upward and notify you that there’s a potential problem on its way. Instead of relying on a hardcoded threshold, Kentik has enough contextual information to know something potentially harmful is brewing.
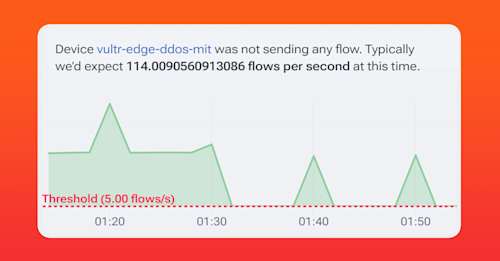
In the graphic below you can see that an edge device wasn’t sending any flow data for a time which Kentik identified as unusual. No, the device isn’t down, but it’s behaving outside the pattern that the system already identified for this device.

Also, consider an unexpected drop in traffic to an ordinarily busy AWS VPC. Typically, alerts fire if there’s a hard-down of a device or an interface or maybe from hitting a utilization threshold. But what about if everything is fine, as there are no hard-down devices, routing problems, overwhelmed interfaces, CPU spikes, or anything else? In these cases, when something unusual happens, Kentik will spot the abnormality and let you know.
Ok, one last example. Since we’re analyzing data points in relation to other data points, Kentik can often identify the possible source of the problem. If there’s an unexpected increase in traffic on a link, Kentik could quickly identify and alert on what specific device or IP address is causing the problem.
In the image below, notice that the platform automatically detected and reported on an unusual increase in traffic on one link on a Juniper device. If you look closely you’ll see that we’re talking about only a few MB, but it’s still unusual and therefore something the system alerted us to.
And even more helpful is the notification at the bottom that identifies the likely cause of the traffic increase.

In conclusion
Understanding the vast volume and variety of telemetry we ingest from our systems must be done in context, usually an application. That’s the whole point of these complex systems we manage. However, this requires not just the collection of data but also the intelligent integration and analysis of diverse telemetry sources.
Kentik empowers engineers by providing the tools necessary to ingest, enrich, and analyze large volumes of network data with a comprehensive view – a view in the context of what we all care about. In that way, we can make data-driven decisions to ensure reliable and performant application delivery even when we consider networks we don’t own or manage.


