Unlocking Peak Performance with Kentik’s Azure Network Observability Tools

Summary
In today’s multi-cloud landscape, maintaining smooth and reliable connectivity requires complete visibility into cloud networks. With Kentik, network and cloud engineers gain the tools to monitor, visualize, and optimize Azure traffic flows, from ExpressRoute circuits to application performance, ensuring efficient and proactive operations.
Deep visibility into your public cloud networks is a cornerstone of modern, effective network management. For network and cloud engineers alike, understanding what’s happening within cloud environments such as Azure is not just a necessity – it’s a competitive advantage. Kentik offers unparalleled visibility into public cloud infrastructures, empowering you to filter, parse, and analyze telemetry data exactly how you need it.
The power of cloud visibility with Kentik
Kentik’s unified platform enables deep insight into your cloud and on-prem environments, including complex topologies within Azure. NSG flow logs, cloud metrics, and important metadata are ingested into the system so you can understand traffic among regions crossing numerous cloud network constructs. Moreover, Kentik allows you to interactively drill down into this telemetry, visualize traffic flows, and easily configure alerts and reports based on what you discover.
With Kentik, you gain access to data that helps answer operational questions such as:
- What are the primary traffic sources and destinations across our Azure resources?
- How are ExpressRoute circuits performing, and what kind of traffic are they handling?
- Which security policies are being used, and which aren’t?
These capabilities provide network and cloud engineers the clarity needed to troubleshoot issues, optimize performance, and enforce security policies across cloud environments.
Cloud optimization is crucial to delivering software with lean infrastructure operating margins and enhanced customer experiences.

Exploring Azure network topologies with Kentik Map
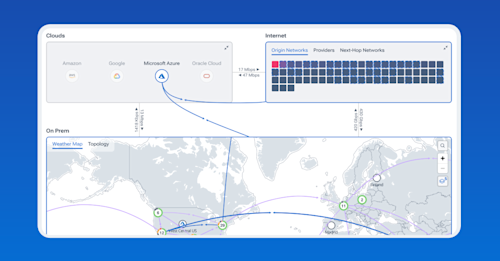
To understand Kentik’s capabilities, let’s first look at the Kentik Map. This feature provides a high-level view of multi-cloud environments, showcasing the different clouds connected to your infrastructure. Here, you can visualize your Azure topology to see connections globally and drill down for detailed insights into traffic flow and resource utilization.
The image below shows an overlay of our Azure connections on a global map. Drilling down into a specific connection is only a matter of clicking the link connecting the sites to expand the details pane on the right. In this case, we’re looking at total traffic between US-WEST-1 and AP-SOUTHEAST-1.

This is a great overview, but to go deeper we can view our Azure topology in an interactive layout where many elements are clickable. From the Kentik Map’s topology view, we can easily drill down into a specific cloud network component, on-prem router, VNet, etc.
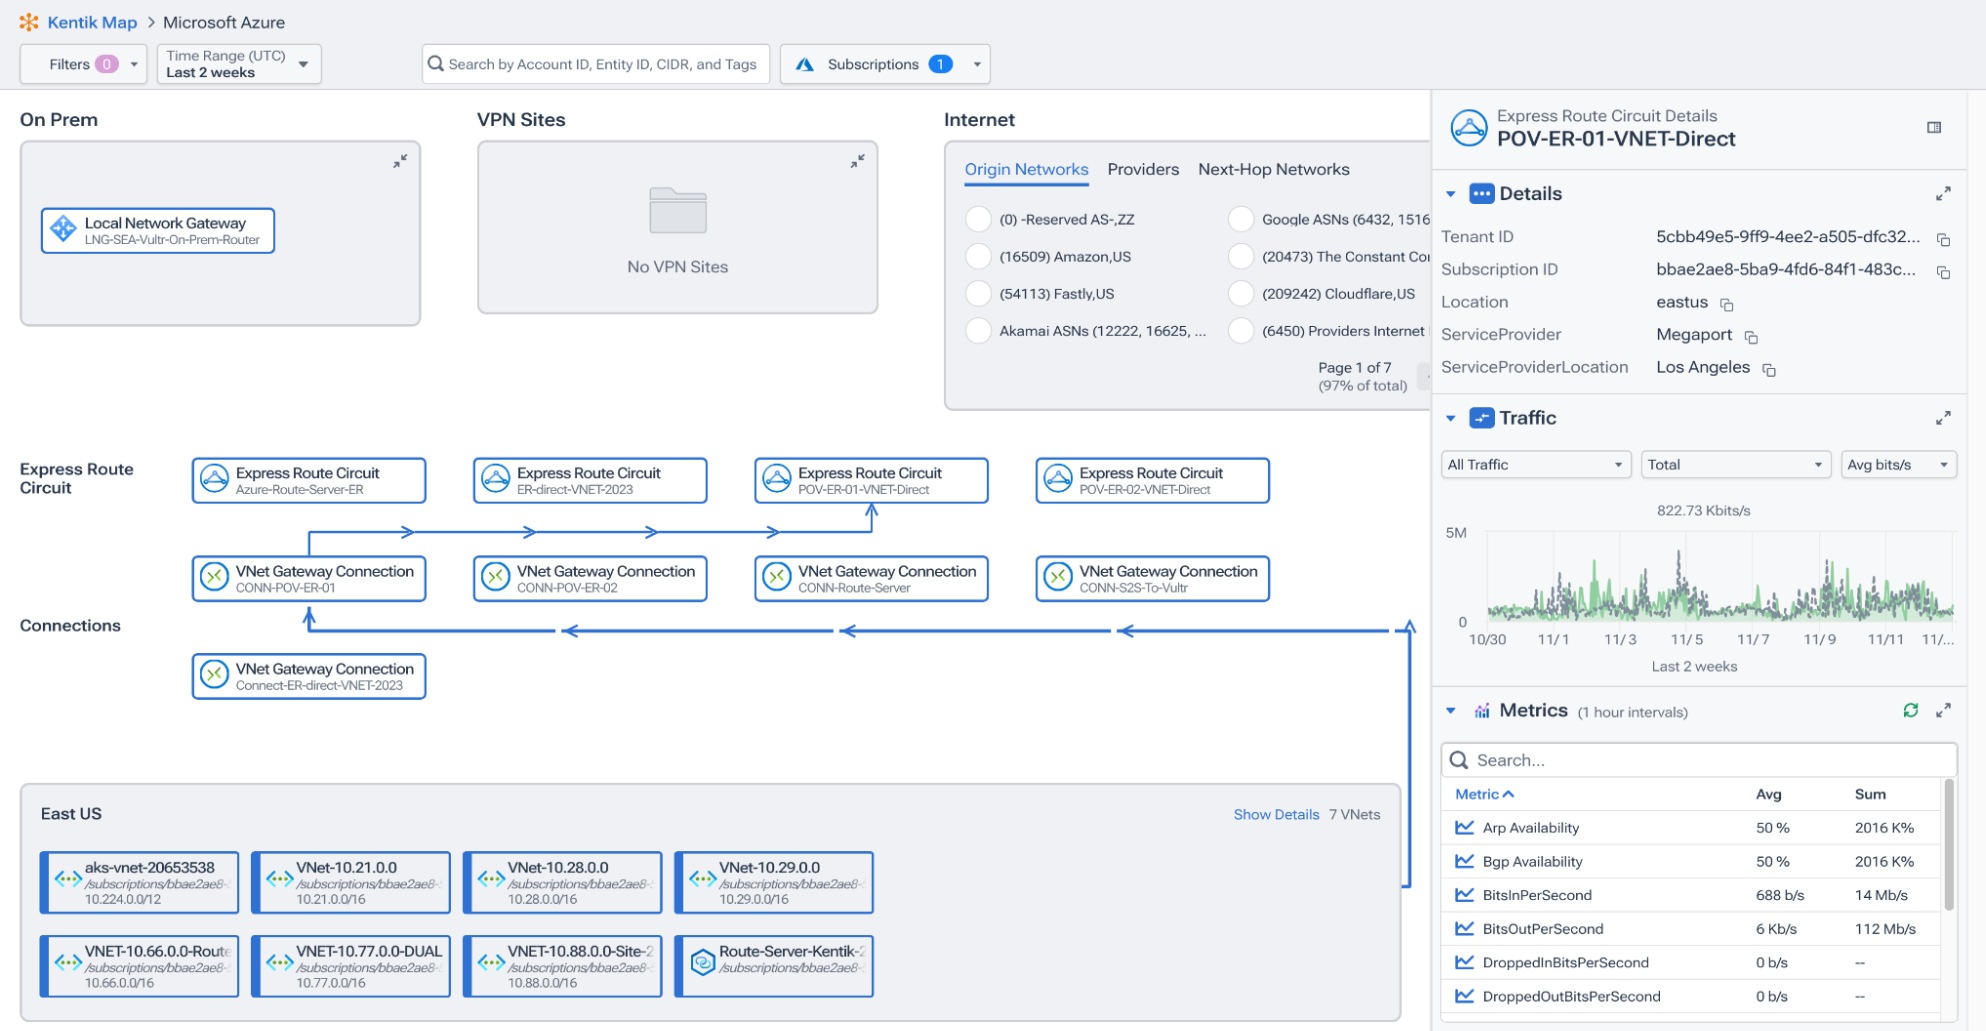
Notice in the image below that we’re looking at traffic flowing from our East US region to VNet Connection Connect-ER-direct-VNET-2023, and then on top of various connections and Express Route Circuits to our on-prem router.

We can also click on many of these elements, such as the individual VNets, Express Route Circuits, and even our on-prem router. For example, take a look at the next screenshot to see that when we select the Express Route Circuit POV-ER-01-VNET-Direct, we get valuable information about traffic flow as well as detailed information about the tenant ID, location, provider, traffic, cloud metrics, and peering information.
This is valuable information for engineers monitoring the performance and stability of these dedicated private connections and identifying potential bottlenecks or misconfigurations.
The Kentik Map is a powerful tool for visualizing traffic flows and drilling down into details about our network cloud elements, but to parse network and cloud telemetry further, we can use Data Explorer.
Deep dive with Data Explorer
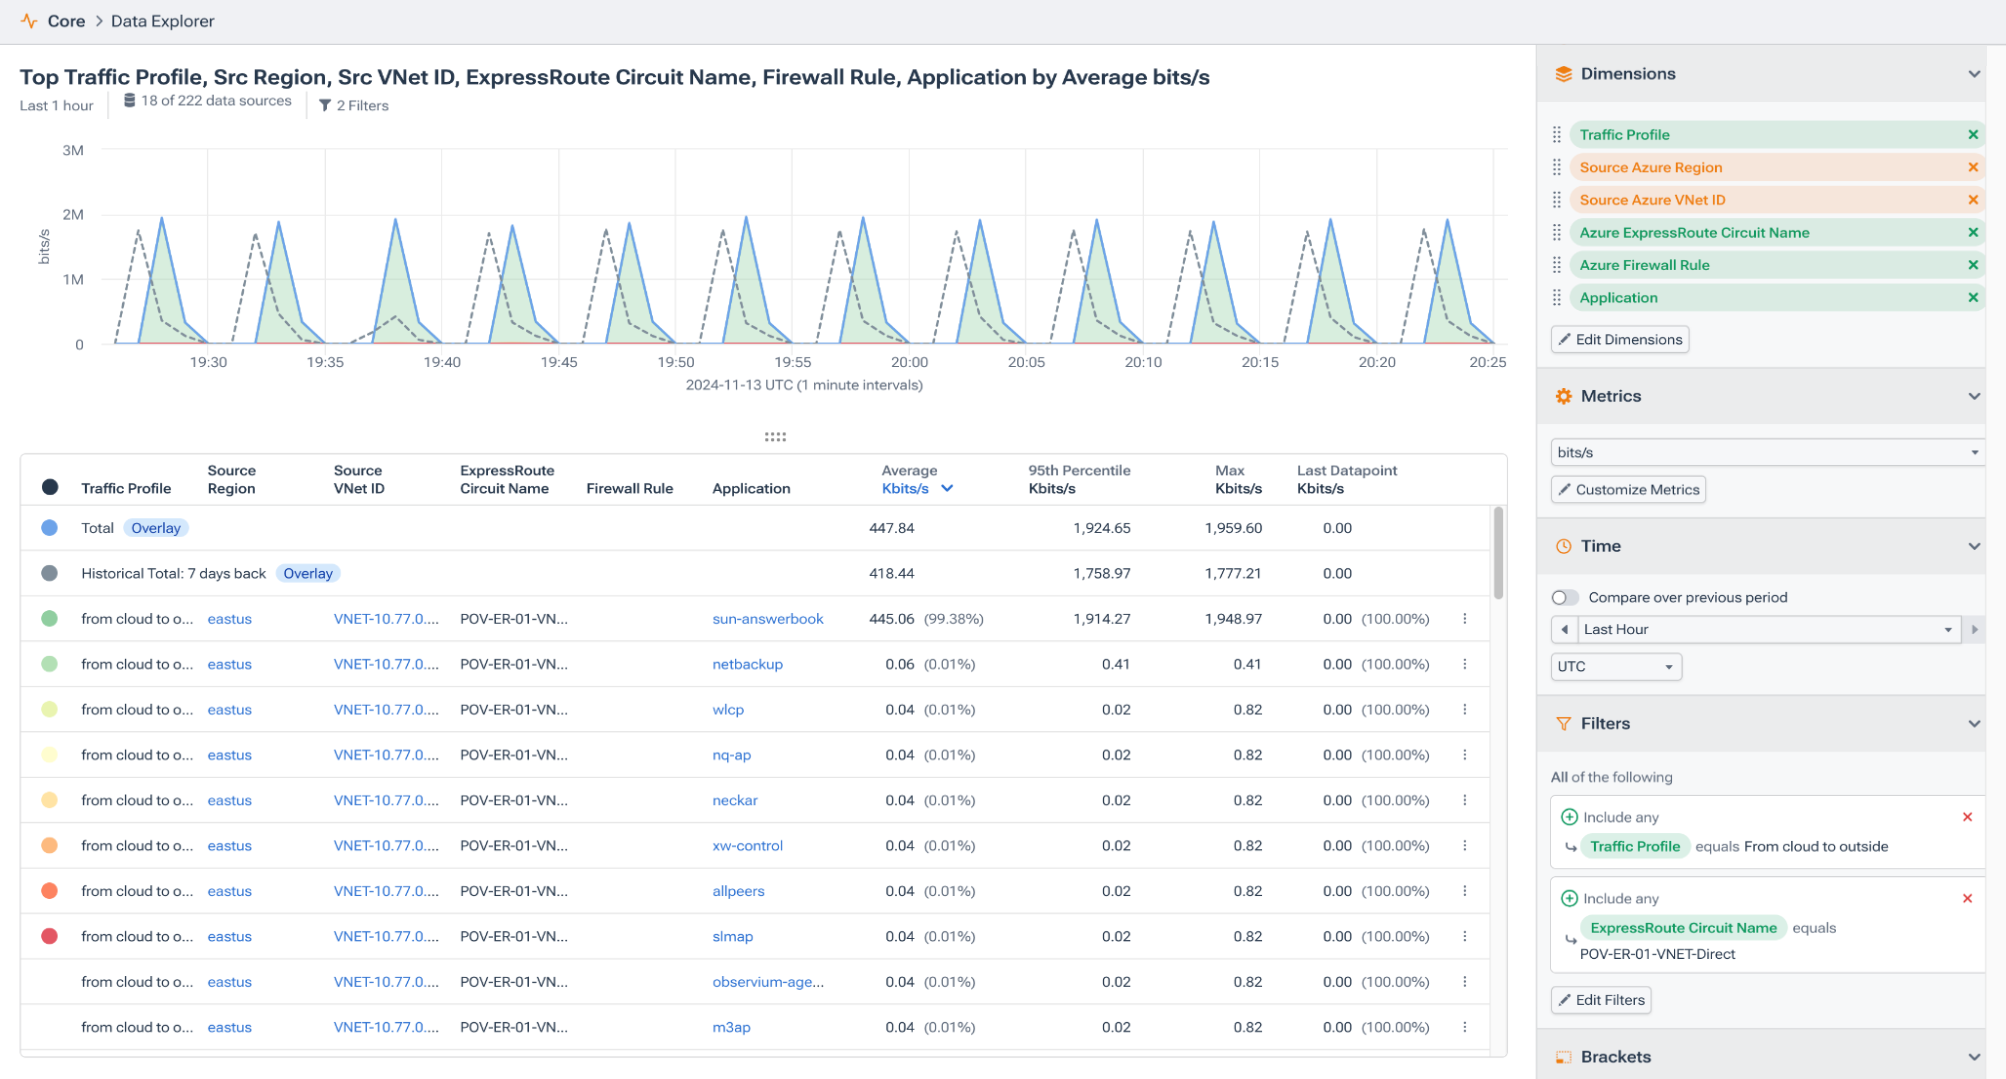
Kentik’s Data Explorer is where you can truly explore data and deeply analyze specific resources and cloud traffic within Azure. Returning to our ExpressRoute example, imagine you need to investigate egress traffic for a particular circuit. Kentik makes it easy to drill down into exactly what you want to see. The image below shows Azure as our data source and several dimensions to filter our data, including source region, VNet, application, firewall rule, ExpressRoute circuit, and so on.
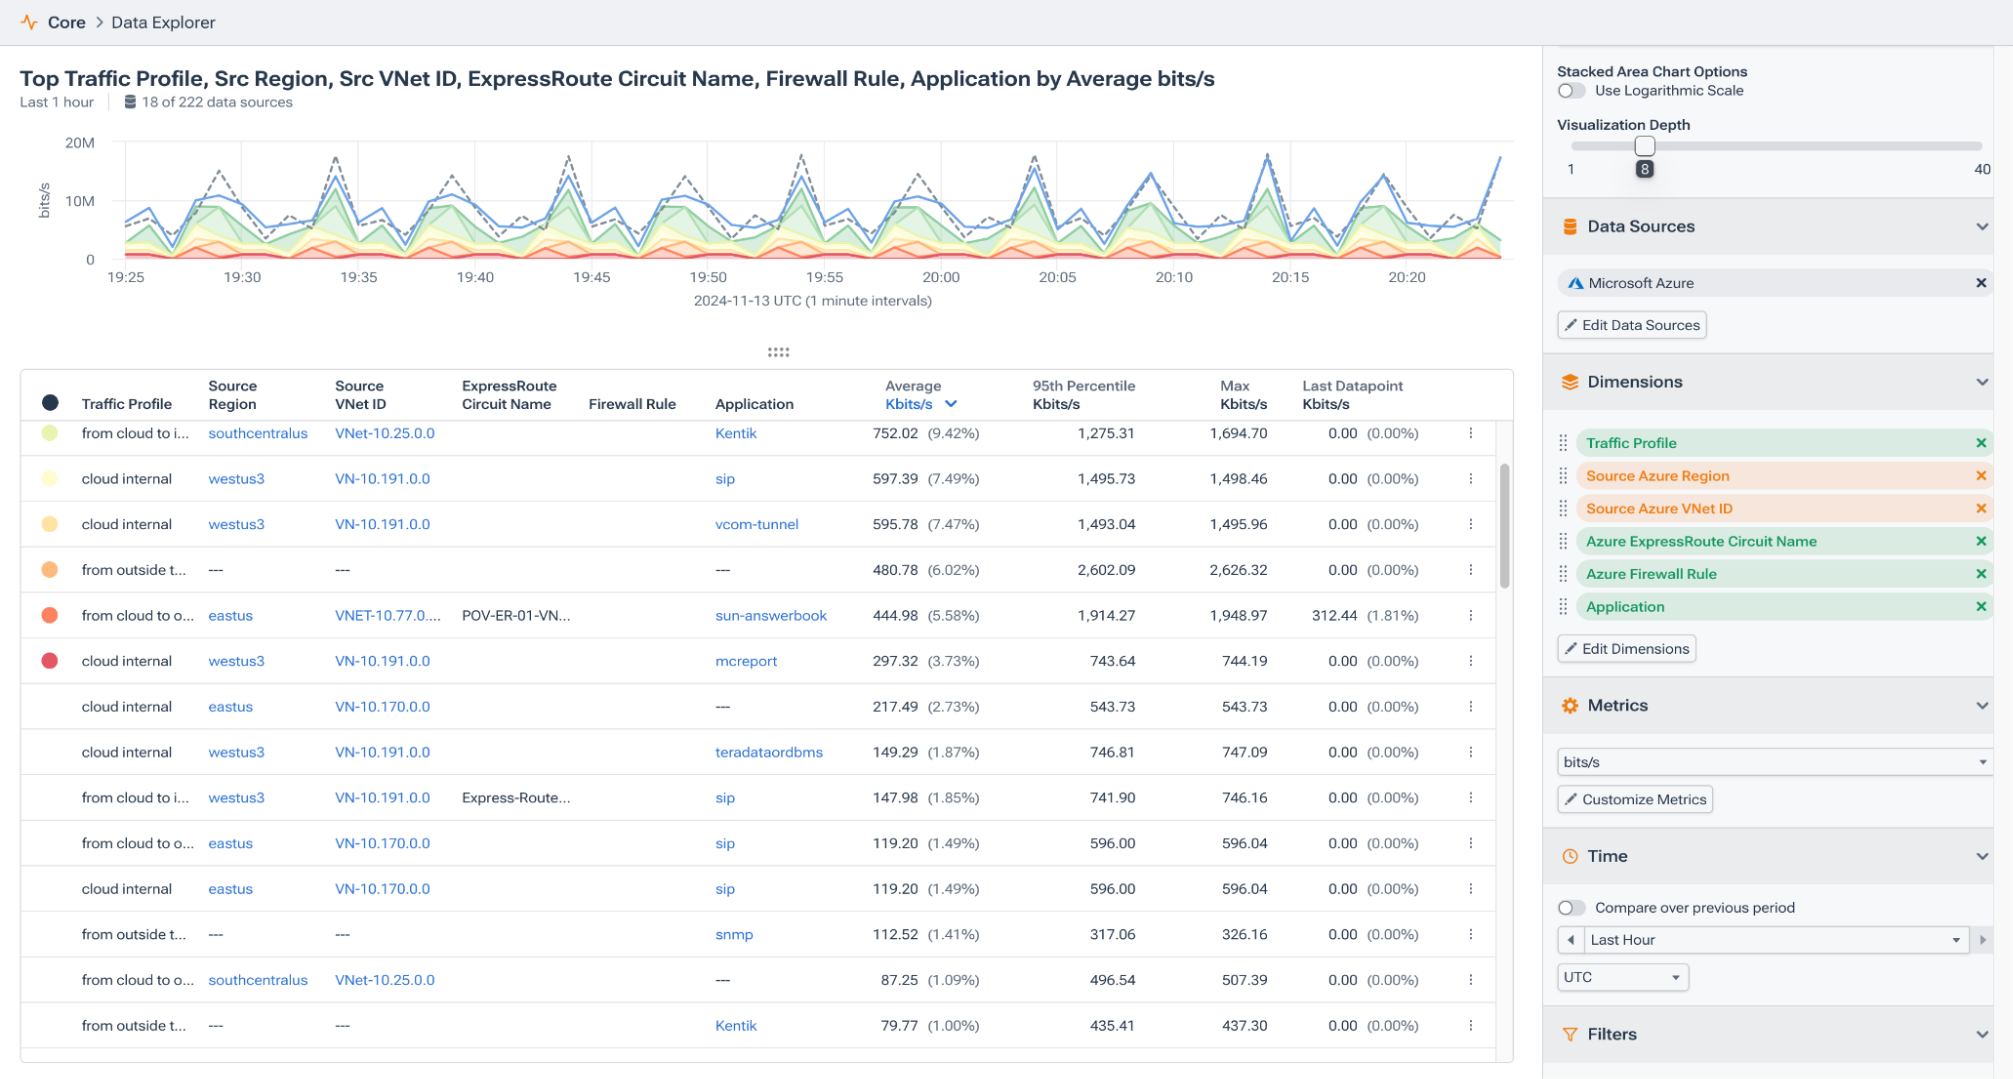
Using the built-in filtering options is great, but Kentik understands that exploring data sometimes means getting more complex with a filtering workflow. What we can do now is create additional filters to fine-tune our query further. Notice in the following image that we’ve added filters to narrow down our search to only outbound traffic and a specific ExpressRoute.
Configuring alerts and reports for proactive monitoring
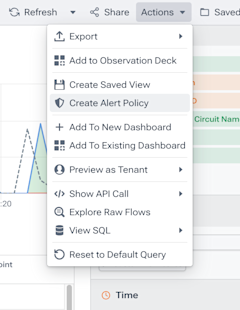
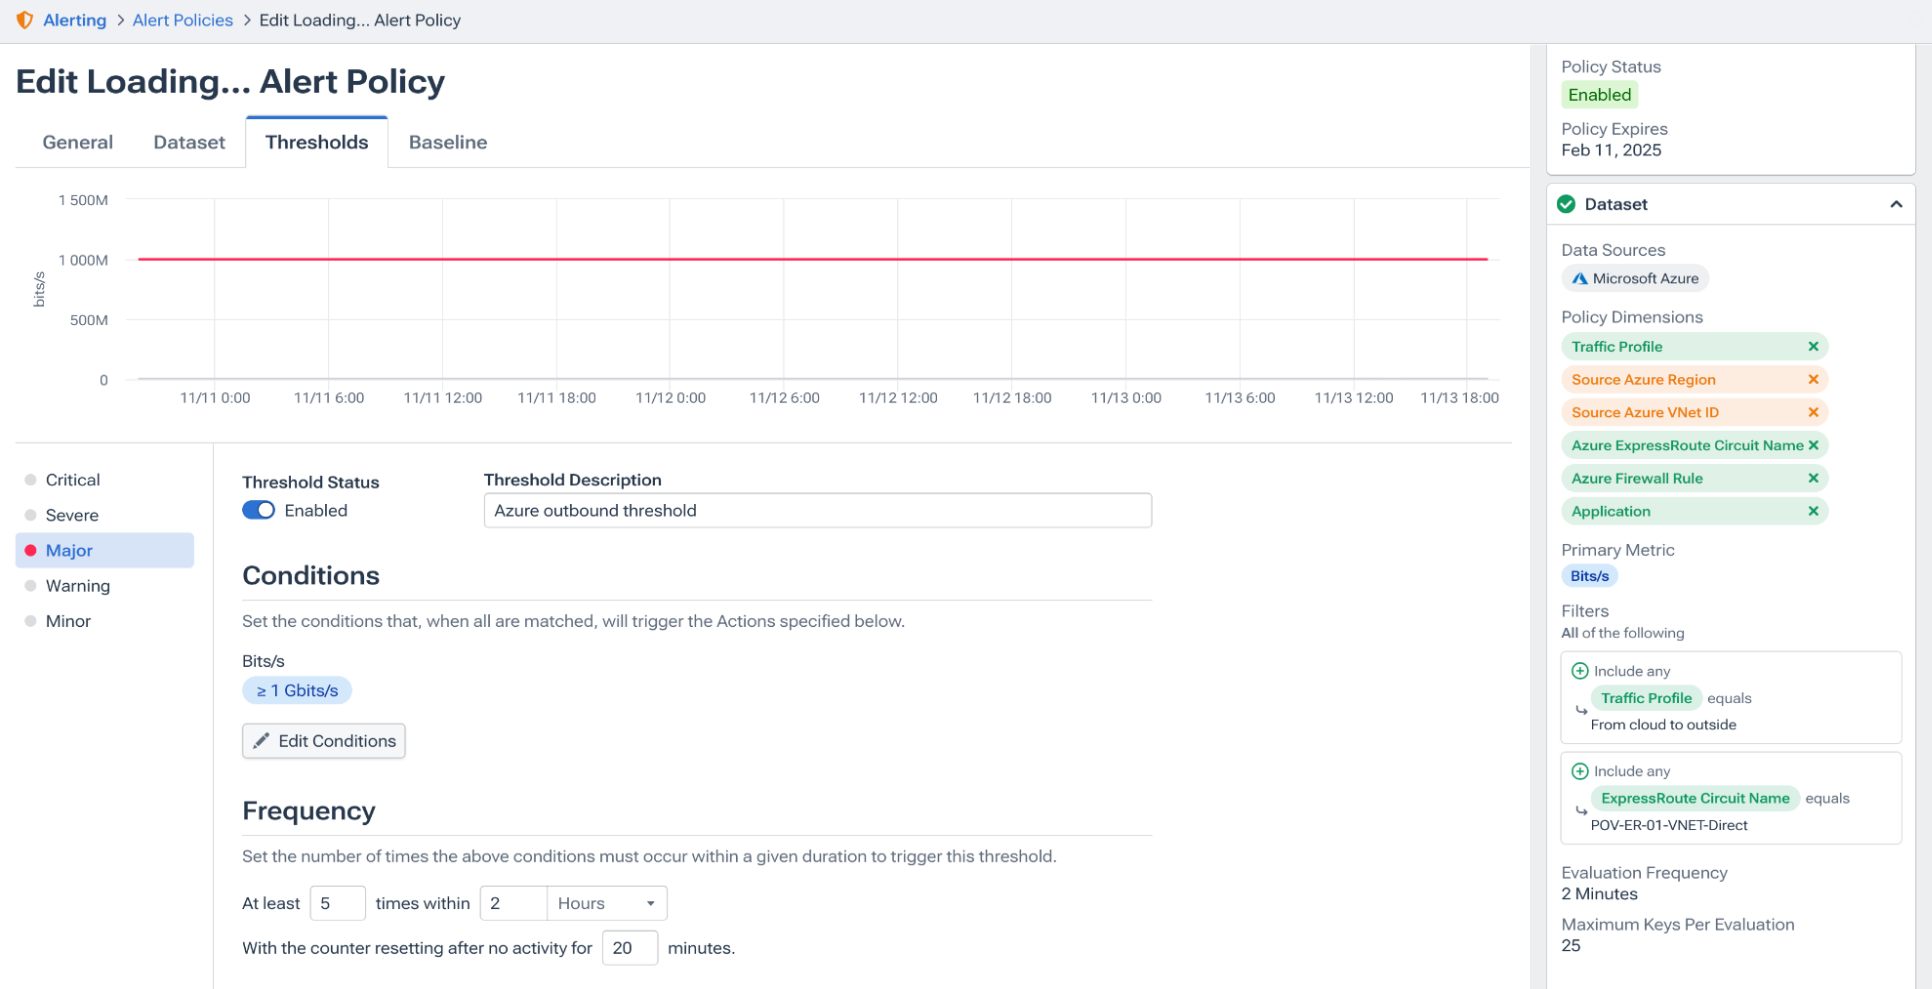
Another of Kentik’s important features is the ability to create alerts and reports directly from any query in Data Explorer. That means once you’ve narrowed down your data to a specific ExpressRoute circuit, outbound traffic, and applications, you can configure real-time alerts that integrate with your ticketing system or set up scheduled reports to keep your team informed.
For example, suppose you’ve identified an increase in outbound traffic from your East US region with just a few mouse clicks. In that case, you can set an alert to trigger when egress traffic exceeds a certain threshold, ensuring proactive monitoring of potential issues. This is especially useful for cloud cost management since high volumes of egress traffic can lead to higher cloud costs.
Bringing visibility to Azure networks
In today’s multi-cloud world, complete visibility into cloud networks is crucial for efficient operations. Kentik empowers network and cloud engineers with the tools to explore, visualize, and monitor Azure traffic flows, ensuring smooth and reliable connectivity.
Whether you’re tracking ExpressRoute circuits, observing application traffic, or setting up alerts for proactive monitoring, Kentik’s platform provides the flexibility and depth needed to optimize cloud infrastructure.


