Using Telegraf to Feed API JSON Data into Kentik NMS

Summary
While many wifi access points and SD-WAN controllers have a rich data set available via their APIs, most do not support exporting this data via SNMP or streaming telemetry. In this post, Justin Ryburn walks you through configuring Telegraf to feed API JSON data into Kentik NMS.
Every once in a while, I like to get my hands dirty and play around with technology. Part of the reason is that I learn best by doing. I also love technology and need to prove to myself occasionally that “I’ve still got it” in my spare time. This article is based on a post I wrote for my personal tech blog.
Kentik recently launched NMS, a metrics platform that ingests data in Influx Line Protocol format, stores it, and provides a great UI to visualize it. We built our own collector, called Ranger, for SNMP and streaming telemetry (gNMI data, but we don’t yet support grabbing JSON data via an API call. Reading through the Telegraf documentation, I realized it should be relatively easy to configure Telegraf to do that. It just so happens I have a Google Wifi setup in my home that exposes an API with some interesting data to observe.
In this blog, I will document how I got this all working. This will allow Kentik users to get this data into NMS while we develop our API JSON data collection in our agent.
If you’re fond of video tutorials, I made a short video version of this blog post that you can watch below:
Docker setup
I am a big fan of installing software using Docker to keep my host clean as I play around with things. I also like to use docker-compose instead of docker run commands to upgrade the containers easily. For Telegraf, I used the following docker-compose.yml file:
---
version: '3.3'
services:
  telegraf:
    container_name: telegraf
    image: 'docker.io/telegraf:latest'
    environment:
      - KENTIK_API_ENDPOINT="https://grpc.api.kentik.com/kmetrics/v202207/metrics/api/v2/write?bucket=&org=&precision=ns"
      - KENTIK_API_TOKEN=(REDACTED)
      - KENTIK_API_EMAIL=(REDACTED)
    volumes:
      - '/home/jryburn/telegraf:/etc/telegraf'
    restart: unless-stopped
    network_mode: host
Telegraf configuration
Once the container was configured, I built a telegraf.conf file to collect the data from the API endpoint on the Google Wifi using the HTTP input with a JSON data format. Using the .tag puts the data into the tag set when exported to Influx, and using the .field puts the data into the field set when it is exported to Influx. Once all the data I want to collect is defined, I define the outputs. Setting up the Influx output is pretty straightforward: configure the HTTP output to use the Influx format. I had to define some custom header fields to authenticate the API call to Kentik’s Influx endpoint. I also output the data to a file to simplify troubleshooting, an entirely optional step.
# Define the inputs that telegraf is going to collect
[global_tags]
device_name = "basement-ap"
location = (REDACTED)
vendor = "Google"
description = "Google Wifi"

[[inputs.http]]
    urls = ["http://192.168.86.1/api/v1/status"]
    data_format = "json_v2"
    # Exclude url and host items from tags
    tagexclude = ["url", "host"]

    [[inputs.http.json_v2]]
        measurement_name = "/system" # A string that will become the new measurement name
        [[inputs.http.json_v2.tag]]
            path = "wan.localIpAddress" # A string with valid GJSON path syntax
            type = "string" # A string specifying the type (int,uint,float,string,bool)
            rename = "device_ip" # A string with a new name for the tag key
        [[inputs.http.json_v2.tag]]
            path = "system.hardwareId" # A string with valid GJSON path syntax
            type = "string" # A string specifying the type (int,uint,float,string,bool)
            rename = "hardware-id" # A string with a new name for the tag key
        [[inputs.http.json_v2.tag]]
            path = "software.softwareVersion" # A string with valid GJSON path syntax
            type = "string" # A string specifying the type (int,uint,float,string,bool)
            rename = "software-version" # A string with a new name for the tag key
        [[inputs.http.json_v2.tag]]
            path = "system.modelId" # A string with valid GJSON path syntax
            type = "string" # A string specifying the type (int,uint,float,string,bool)
            rename = "model" # A string with a new name for the tag key
        [[inputs.http.json_v2.field]]
            path = "system.uptime" # A string with valid GJSON path syntax
            type = "int" # A string specifying the type (int,uint,float,string,bool)

# # A plugin that stores metrics in a file
[[outputs.file]]
    ## Files to write to, "stdout" is a specially handled file.
    files = ["stdout", "/etc/telegraf/metrics.out"]
    data_format = "influx" # Data format to output.
    influx_sort_fields = false

# A plugin that can transmit metrics over HTTP
[[outputs.http]]
    ## URL is the address to send metrics to
    url = ${KENTIK_API_ENDPOINT} # Will need API email and token in the header
    data_format = "influx" # Data format to output.
    influx_sort_fields = false

    ## Additional HTTP headers
    [outputs.http.headers]
        ## Should be set manually to "application/json" for json data_format
        X-CH-Auth-Email = ${KENTIK_API_EMAIL} # Kentik user email address
        X-CH-Auth-API-Token = ${KENTIK_API_TOKEN} # Kentik API key
        Content-Type = "application/influx" # Make sure the http session uses influx
The following is what the JSON payload looks like when I do a curl command against my Google Wifi API. It should help to better understand the fields I configured Telegraf to look for.
{
    "dns": {
        "mode": "automatic",
        "servers": [
            "192.168.1.254"
        ]
    },
    "setupState": "GWIFI_OOBE_COMPLETE",
    "software": {
        "blockingUpdate": 1,
        "softwareVersion": "14150.376.32",
        "updateChannel": "stable-channel",
        "updateNewVersion": "0.0.0.0",
        "updateProgress": 0.0,
        "updateRequired": false,
        "updateStatus": "idle"
    },
    "system": {
        "countryCode": "us",
        "groupRole": "root",
        "hardwareId": "GALE C2E-A2A-A3A-A4A-E5Q",
        "lan0Link": true,
        "ledAnimation": "CONNECTED",
        "ledIntensity": 83,
        "modelId": "ACjYe",
        "oobeDetailedStatus": "JOIN_AND_REGISTRATION_STAGE_DEVICE_ONLINE",
        "uptime": 794184
    },
    "vorlonInfo": {
        "migrationMode": "vorlon_all"
    },
    "wan": {
        "captivePortal": false,
        "ethernetLink": true,
        "gatewayIpAddress": "x.x.x.1",
        "invalidCredentials": false,
        "ipAddress": true,
        "ipMethod": "dhcp",
        "ipPrefixLength": 22,
        "leaseDurationSeconds": 600,
        "localIpAddress": "x.x.x.x",
        "nameServers": [
            "192.168.1.254"
        ],
        "online": true,
        "pppoeDetected": false,
        "vlanScanAttemptCount": 0,
        "vlanScanComplete": true
    }
}
Once I start the Docker container, I tail the logs using docker logs -f telegraf and see the Telegraf software loading up and starting to collect metrics.
2024-02-25T17:15:44Z I! Starting Telegraf 1.29.4 brought to you by InfluxData the makers of InfluxDB
2024-02-25T17:15:44Z I! Available plugins: 241 inputs, 9 aggregators, 30 processors, 24 parsers, 60 outputs, 6 secret-stores
2024-02-25T17:15:44Z I! Loaded inputs: http
2024-02-25T17:15:44Z I! Loaded aggregators:
2024-02-25T17:15:44Z I! Loaded processors:
2024-02-25T17:15:44Z I! Loaded secretstores:
2024-02-25T17:15:44Z I! Loaded outputs: file http
2024-02-25T17:15:44Z I! Tags enabled: description=Google Wifi device_name=basement-ap host=docklands location=(REDACTED) vendor=Google
2024-02-25T17:15:44Z I! [agent] Config: Interval:10s, Quiet:false, Hostname:"docklands", Flush Interval:10s
/system,description=Google\ Wifi,device_ip=x.x.x.x,device_name=basement-ap,location=(REDACTED),model=ACjYe,os-version=14150.376.32,serial-number=GALE\ C2E-A2A-A3A-A4A-E5Q,vendor=Google uptime-sec=2801i 1708881351000000000
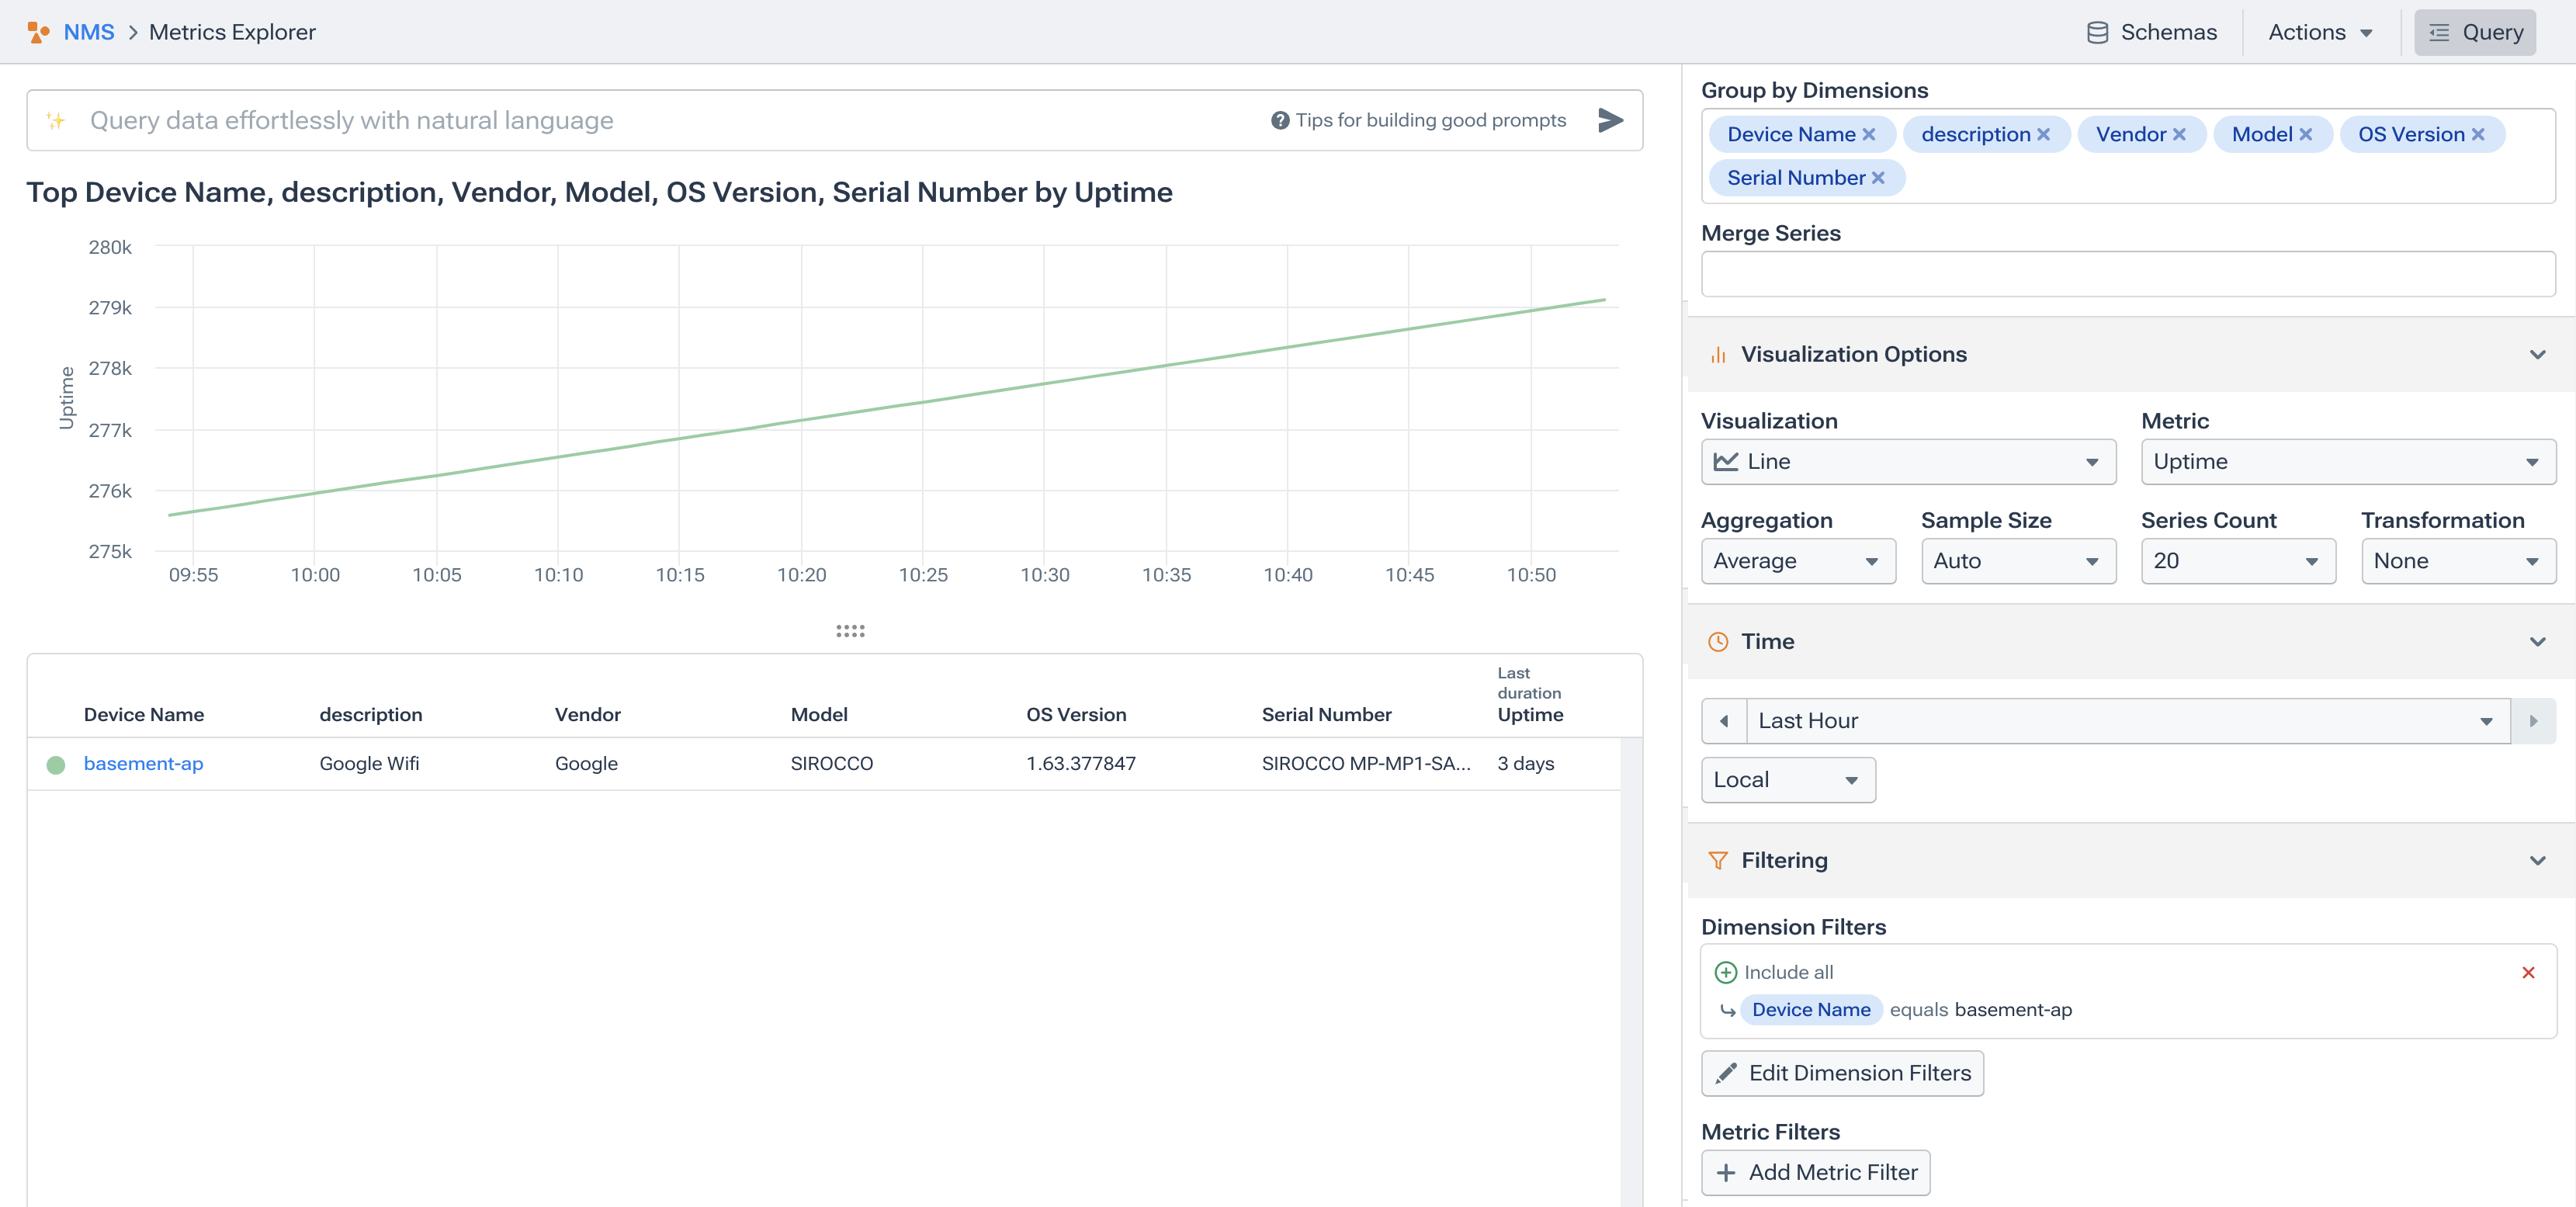
Now I hop over to the Kentik UI, where I am sending the Influx data, and I can see I am collecting the data there as well.

Next steps
With Telegraf set up to ingest JSON, I have opened the door to a critical new data type in Kentik NMS. While many wifi access points and SD-WAN controllers have a rich data set available via their APIs, the challenge is that they do not support exporting this data via SNMP or streaming telemetry. By configuring Telegraf to collect and export this data in Influx, I can graph and monitor the metrics available via those APIs in the same UI to monitor SNMP and streaming telemetry data.
Adding data from APIs to the context-enriched telemetry available in Kentik NMS will make it faster to debug unexpected issues. It also allows me to explore this rich dataset ad-hoc to help me make informed decisions. If you want to try this yourself, get started by signing up for a free Kentik trial or request a personalized demo.


