Visibility into the cloud path of application latency

Summary
A company with thousands of remote employees connecting to the same SaaS applications will randomly experience slowness. How can we troubleshoot this sluggishness?
Ever find yourself sitting in your home office wondering why your connection to Google Docs or Salesforce is uncharacteristically slow? When this happens to me, I start with my troubleshooting basics. Opening a few additional browser tabs and visiting other websites such as ford.com or amazon.com is one of my favorite tactics. I click around on these sites and ask myself if they feel slowish. Sometimes I’ll even launch a different browser. If I’m using Chrome then I’ll launch Firefox and run the same basic tests. I then think about the applications I have running on my old laptop. I think to myself, “Hey self, maybe something is slowing down your computer.” I shut down apps and unneeded tabs in my browser to see if this helps and it usually doesn’t.
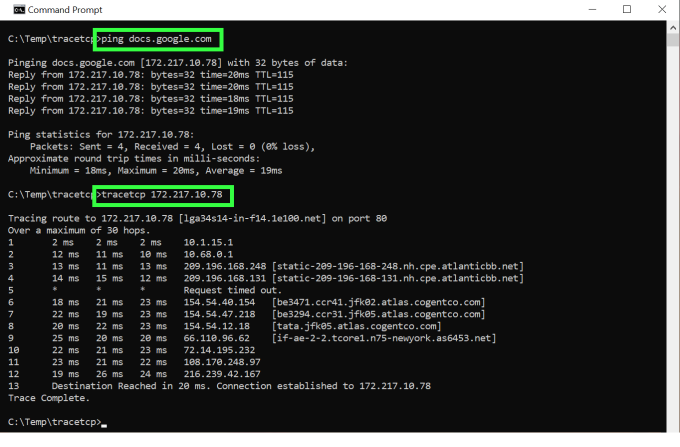
If I don’t like the results from the above, I might launch a ping or a TCP traceroute to see if I get any packet loss or high-latency responses.

If the response comes back like the above, I’ll probably reboot my computer, my internet router or maybe both and hope that this fixes the problem. If, however, the command-line tests show significant latency then I know it isn’t me. “There’s nothing I can do,” I tell myself. I press on with my work and try not to let the poor connection speed to the cloud slow me down. What if I wasn’t the only one suffering from this latency and it was happening nearly every day? What if my home was actually a large, remote office building containing hundreds of others who work for the same company using the same cloud apps? Since everyone trying to do their job in the same application is suffering, the issue is much more consequential. Something has to be done!
Great NetOps teams anticipate SaaS application latency
It would be silly to think, in a company with thousands of remote employees, that connections to the same SaaS applications won’t periodically be slow. With all the vendors involved in making cloud connections possible and the anticipated, random bursts in internet traffic, intermittent sluggishness is just going to happen. We know this.
Proactive NetOps teams anticipate these problems and build out the cloud infrastructure in a way that minimizes slowness issues. To do this, it requires a non-cloudy understanding in two areas:
- Historical response-time awareness from remote locations to the targeted SaaS applications
- BGP route comprehension
By having a baseline of historical latency from remote offices to selected SaaS applications (e.g., Google Docs, Salesforce, etc.), NetOps teams are aware of what acceptable performance patterns look like. When this data is paired with how BGP is directing traffic through the cloud, an aha-like moment can occur where the source of the latency through the cloud path becomes obvious.
Digital experience monitoring
In order to build a baseline of end-user experience to SaaS applications, we need a digital experience monitoring mechanism for data collection. One of the best ways to do this is through the deployment of synthetic transaction monitors (STM). STMs come in the form of small software agents that can reside on-prem or in the cloud. They are given instructions like connect to Google Docs every second or every minute, record the latency, and send the metric off to the collection platform. These agents will also perform traceroutes similar to what I showed above and send this data off to the collection platform as well. The data ingested from these agents provide us with two important pieces of information:
- The connection latency to the SaaS over an extended period of time
- The path through the cloud that is taken to the SaaS over an extended period of time
This information can answer a few questions:
-
When people in a remote location complain about slowness, is the on-prem synthetic transaction monitor indicating the same latency pattern? If not, the problem could be local. If yes, move on to question 2.
-
When the latency occurred, did the path through the cloud change? How did it change? And which router or autonomous system introduced the latency?
Like any conundrum we face, once we know where the problem is being introduced, we can start the process of going about fixing it.
The cloud path of application latency
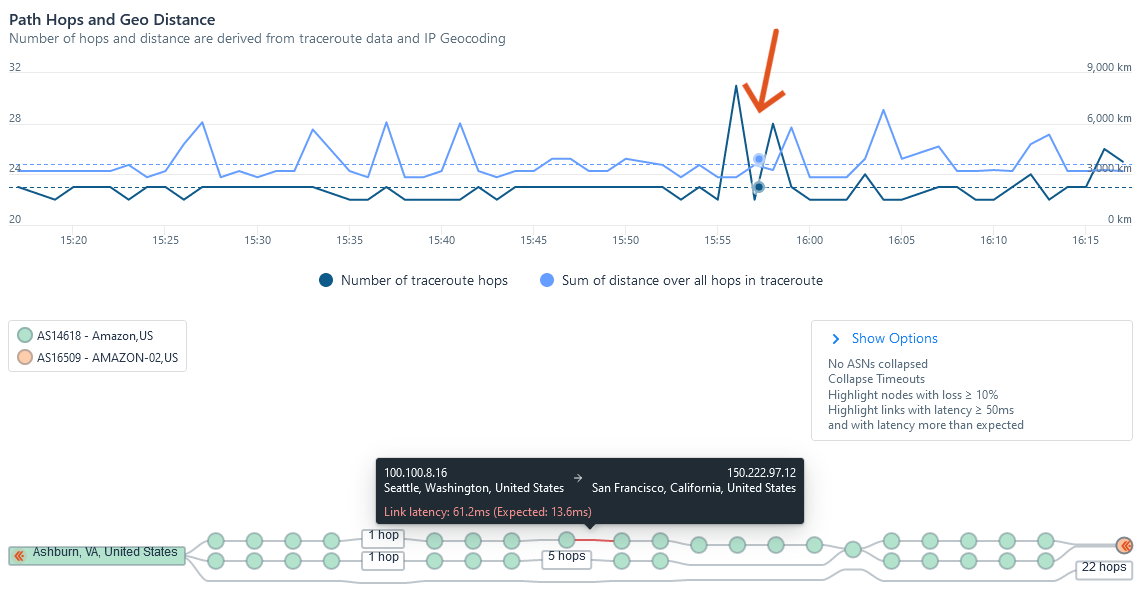
To visualize the path and the location where the latency was introduced, we need an observability platform. Below you can see where I moused over the timeline, indicated by the orange arrow. When I do this, the hop-by-hop path updates below and indicates where latency was introduced. Notice that it happened at a time when the physical distance between the communicating systems wasn’t out of the ordinary.

In the picture above, by mousing over the little green circles at the bottom, the IP address of the hops are listed. If you mouse over any of the red connections, it provides details on the variance of the expected latency.
Loaded with the above information, we can investigate whether or not this is a consistent problem. If we ascertain that the issue is recurring, we can explore options that allow us to mitigate the issue (i.e., go around the problem hop). How do we do this?
How to reduce cloud application latency
In order to get around the problem hop, a company has a few options. These solutions depend on the location of the SaaS in respect to the users suffering from the connection problem. NetOps could:
- Speak with the service provider and ask them to find a new path for the connections to the targeted SaaS
- Look to adjacent service providers to see if peering would get the users closer to the CDN serving up the needed content
- Explore new transit that avoids the problem hop
Given the cost to make a change and the benefits of making it, the best course of action can be implemented. Without access to STMs, a good understanding of BGP and a network observability platform that ties it all together, identifying the trouble spot is much more difficult.
If you would like to learn more about visibility into the cloud path of application latency and the use of synthetic transaction monitors to enhance your digital experience monitoring efforts, reach out to the team at Kentik.


