Summary
Cloud providers take away the huge overhead of building, maintaining, and upgrading physical infrastructure. However, many system operators, including NetOps, SREs, and SecOps teams, are facing a huge visibility challenge. Here we talk about how VPC flow logs can help.
The Need for Visibility in the Cloud

The cloud is science, not magic.
By now, we should all appreciate that cloud providers take away the huge overhead of building, maintaining, and upgrading physical infrastructure, and allow organizations to better focus on their own core competencies. However, with public clouds abstracting organizations’ underlying physical layers, only showing the logical/virtualized views, and with distributed systems across on-prem and multiple public clouds, system operators (including NetOps, SREs, SecOps, etc.) are facing a huge visibility challenge.
To surface and help address these challenges, we interviewed some of our customers who have migrated their workloads from on-premises to the public cloud, as well as those who deployed greenfield cloud-native applications. Here are three key challenges frequently mentioned:
-
Challenge #1 - Traditional appliance-based monitoring tools don’t work. Since you lose ownership of the physical layer, there is nowhere to “plug in” physical appliances. You may still use monitoring appliances in your private/on-prem data centers, but how will you see the other side of the world (your footprints in public clouds)? It’s an all-or-nothing scenario; any mid-ground solution will not fly.
-
Challenge #2 - The “lift and shift” cloud migration method has become less popular. Many network operators now want to promote cloud-native architecture when migrating to the public cloud to fully leverage the cloud’s benefits. However, app behavior and performance become a big uncertainty without proper real-time micro and macro visibility of the infrastructure. “Dynamically orchestrated” and “microservices-oriented” are key aspects of “cloud-native” architecture that make this especially challenging.
-
Challenge #3 - Cost management has never been so tricky. Are there hidden fees behind your cloud bill? Some have heard that only egress traffic is chargeable, or that inter-region/VPC bandwidth is more expensive than intra-region/VPC traffic, and that traffic consumption may be charged differently for each geo / zone. We’ve heard from many organizations who were shocked to see much higher bills than they initially expected, with few details available to understand what factors are driving those costs.
In a nutshell, networking is not only not going away, but it’s becoming a more critical piece of the puzzle when aiming to guarantee app availability and performance while maintaining cost control. That’s why network monitoring must transform to support cloud environments and provide the same level of insight and transparency that operators are accustomed to having in traditional infrastructure. That’s the only way operators will feel comfortable moving critical applications into a cloud environment.

Good News! Cloud Giants Now Offer Visibility via Cloud Flow Logs
As mentioned above, if you don’t operate physical infrastructure, getting complete network visibility has been almost impossible. However, we are happy to see cloud giants like Google (GCP), Amazon (AWS), and Microsoft (Azure) acknowledge their customers’ demands for real visibility by adding virtual private cloud (VPC) flow data—sometimes called “cloud flow logs”—to their offerings. Let’s take a moment to review what each of them provides.
Google GCP - VPC Flow Logs
GCP VPC Flow Logs capture telemetry data like NetFlow, plus additional metadata that specific to GCP. As shown in the below diagram, customers can leverage VPC Flow Log monitoring to track network activity over ① Google Cloud interconnects, ② over VPNs, ③ between workloads, ④ from endpoints going out over the Internet, and ⑤ from workloads to Google services.

These logs include a variety of rich data points, including the IP 5-tuple that we are very much familiar with (which contains the source IP, source port, destination IP, destination port, and the layer 4 protocol). Moreover, the logs also store information like timestamps, performance metrics (e.g. throughput, RTT) and endpoint tags such as VPC, VM name and geo annotations. According to Google, their VPC Flow Logs are meant to promote use cases such as network monitoring, network usage and egress optimization, network forensics and security analytics, and real-time security analysis.
A couple of their highlights worth mentioning with these logs are::
- Speed - GCP VPC Flow Log generation happens in near real-time (updates every 5 seconds vs. minutes) — which means the flow data have 5-second granularity.
- Openness - Google promotes a partner ecosystem, meaning all of those flow logs can be exported to the partner system for analysis and visualization.
For more information, please refer to their official docs and announcement:
Amazon AWS - VPC Flow Logs
AWS was the first cloud provider to make their VPC Flow Logs available to customers, with the goal of helping their users to troubleshoot connectivity and security issues and make sure that network access rules work as expected. With VPC Flow Logs, AWS enables the ability to capture information about the IP traffic going to and from network interfaces in a VPC.
What you need to know about AWS VPC Flow Logs:
- Agentless
- Can be enabled per ENI (Elastic Network Interface), per subnet or per VPC
- Includes actions (ACCEPT / REJECT) of Security Group rules
- Can be used to analyze and troubleshoot network connectivity and more
AWS flow log records are a space-separated string that has the following format:
<version> <account-id> <interface-id> <srcaddr> <dstaddr> <srcport> <dstport> <protocol> <packets> <bytes> <start> <end> <action> <log-status>AWS Flow Log configuration can also be managed with APIs. That means you can create, describe and delete flow log records using the Amazon EC2 Query API, and view flow log records using their CloudWatch API.
For more information, please refer to their official docs:
Microsoft Azure - Flow Logging & Virtual Network TAP
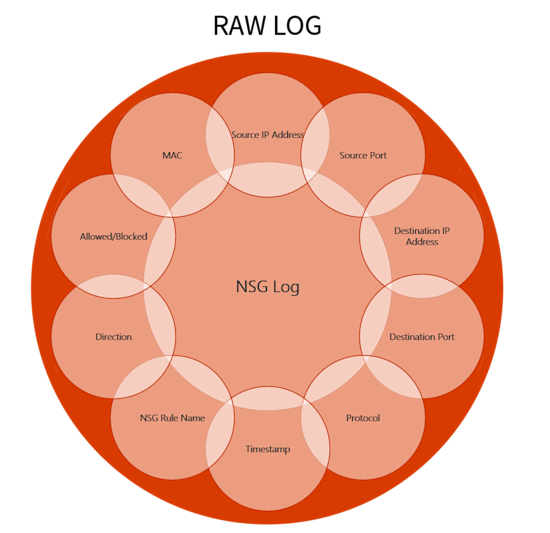
Azure flow logging is a feature of Azure Network Watcher, a tool used to monitor, diagnose, and gain insights into Azure cloud’s network performance and health. Azure flow logging allows you to view information about ingress and egress IP traffic through a Network Security Group (NSG). Similar to what AWS and GCP offer, Azure flow logs show outbound and inbound flows with 5-tuple details about the flow in JSON format. The nuance here is that the flows are on a per-rule basis, therefore, whether or not the traffic was allowed or denied is also captured.

Furthermore, Azure has its virtual network TAP (Terminal Access Point) in developer preview in the west-central-us region recently. This is the service that allows you to continuously stream the VM network traffic to an analytics tool.
For more information, please refer to their official docs:
Kentik’s Cloud Visibility Solution
Kentik’s mission is to offer the world’s most powerful network analytics. We’ve already addressed many use cases across both internal networks and the internet. And now, our mission is expanding seamlessly to cloud-native networks.
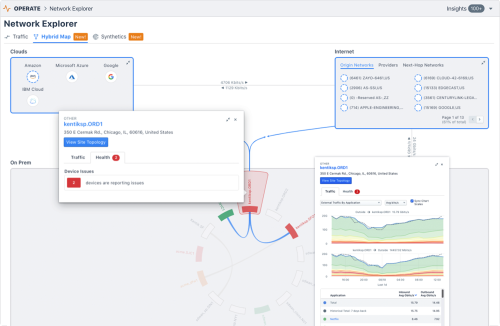
Kentik now accepts VPC flow logs as flow data sources and can take full advantage of each cloud provider’s tags to add infrastructure, application, and service context to the data presented in the Kentik User Interface (for GCP and AWS as of now; Azure is coming in the near future).
With support for VPC flow logs from public cloud, Kentik provides a 360° view of the performance, composition, and paths of actual traffic — no matter where your workloads are located. We’ve combined our deep network analytics with application and business data to help optimize your costs, ensure your cloud-deployed apps are delivering a great customer experience and grow your revenue.

For more information, check out our Kentik for Google Cloud VPC Flow Logs blog post.


