Why Can’t Network Teams Have Nice Things?

Summary
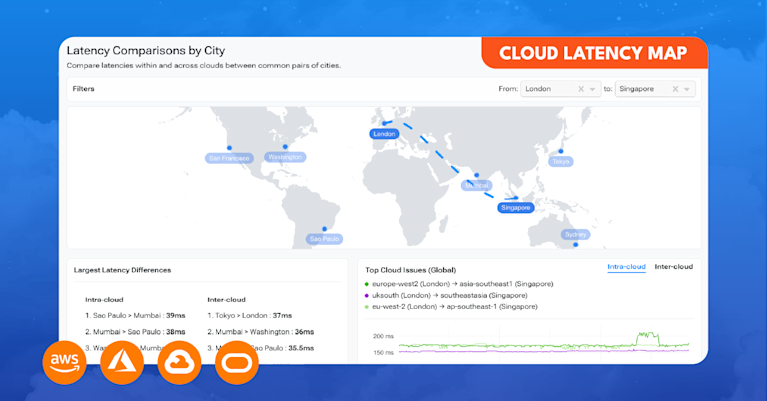
Let me tell you something you already know: Networks are more complex than ever. They are massive. They are confounding. Modern networks are obtuse superorganisms of switches, routers, containers, and overlays; a hodgepodge of telemetry from AWS, Azure, GCP, OCI, and sprawling infrastructure that spans more than a dozen timezones.
Despite this (or perhaps in part because of it), customer expectations have never been higher. Everyone expects everything to work perfectly all the time. Every time. Every moment.
So, in my loudest, most strident, and most concerned voice, I must ask, “Why are network engineers stuck with tools that don’t work?” Or, in a more gentle tone: “Don’t network teams deserve nice things too?”
Modern networks require — not need, but require — modern network solutions.
Legacy network performance monitoring systems (they might rhyme with shiverbed or rollerwinds) are not capable of delivering on the ever-expanding needs of network, cloud, and security engineers. And, more importantly, the needs of the eight billion people whose lives are, for better or worse, inextricably linked to the networks that connect them to the world and one another.
This is the part where I talk about Kentik
Kentik ingests telemetry from physical and virtual infrastructure at mind-numbing scale. (200 trillion flows were processed and stored in 2022!) It synthesizes, analyzes, and adds context to this data so anyone can answer any question about their network. Or set up alerts and automation to surface and resolve issues without even needing to ask.
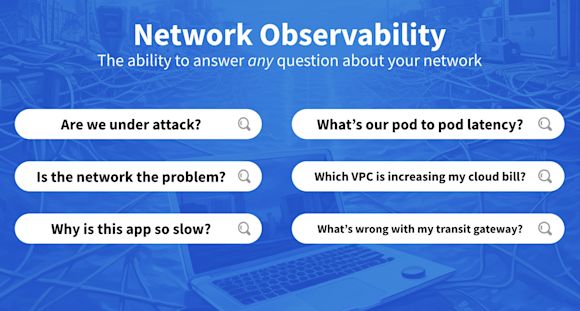
Another way to look at it: Kentik doesn’t just highlight what is happening, but indicates why, and what needs to be done to resolve an issue.
Rather than re-label features and point solutions like three network monitoring solutions in a trenchcoat (I may have watched too many episodes of BoJack Horseman), Kentik is a single, unified platform for network performance, visibility, cost, capacity, and security that just so happens to have an NPS score so high it can only be described as “cult-like” super duper good. Ya, that’s a safer way to write that.
The definitive guide to running a healthy, secure, high-performance network
Hybrid cloud visibility is table stakes now (or at least will be soon)
Visibility with a hybrid cloud infrastructure is tough. Not only do you need insight into the traffic flowing within the networks you control, but you also need to see traffic in networks you don’t control. And that’s not even taking the public internet into account. It’s a lot of data from a lot of sources, and even the smallest blind spot can end up being disastrous. This can be something really bad, like losing hundreds of thousands of dollars because customers cannot order your products, or something really, really bad, like having to explain to a five-year-old that she can’t watch Bluey.
Kentik’s hybrid cloud visibility is drastically different from legacy tools.
First, Kentik has a unique view of internet traffic patterns and performance. We create path traces and gather performance metrics among major service providers, monitor the performance over the internet of the major cloud providers, and ingest the global routing table to augment our understanding of path selection between our customers and the cloud.
Second, our cloud observability solution (can you guess the name?), Kentik Cloud, ingests flow logs, cost information, application and process tags, and a variety of other data to provide deep visibility into how traffic is moving within a cloud instance, in between cloud regions, between different public clouds, and to on-premises data centers.
This means an engineer can easily visualize the overall traffic flow between AWS (or any of the major cloud providers) and their own private data center, including the internet in between.
Look, we know that legacy NPM and NMS companies pretty much wrote the book on monitoring WANs (even if it is with Java interfaces), but their cloud visibility hasn’t kept up. Collecting flow information with a single tool deployed as a physical or virtual appliance on-prem or in the cloud is a solution for a bygone era. No one, and I mean no one, is excited by the idea of another network appliance. (Except for people selling network appliances. They are over the moon.)
It also means that legacy tools lack visibility into significant network activity, specifically how traffic moves between resources in various clouds, back on-premises, and on the public internet. If you’re running a multi-cloud architecture, good luck finding a legacy solution that supports every major cloud provider — and answers any question you have about your network or how customers experience it.
This is not yet the part where we quote Vanilla Ice
Installing a lightweight test agent at a branch office is one thing, but legacy NMS generally means installing physical and virtual appliances in multiple locations. That means appliances to manage, cooling and power to consider, and failed hard drives and power supplies to plan around; a lot of extra steps with a whole new suite of complications.
That’s why Kentik was designed as a fully SaaS-delivered solution with no physical appliances for customers to install and maintain.
Here’s the typical process of engaging with Kentik:
- Step 1: Read or watch something from the marketing team that CHANGES YOUR LIFE
- Step 2: Write the CMO a nice email about how amazing the marketing team is
- Step 3: Succumb to a web form (yes, no one likes them) and start a Kentik trial or get a demo
- Step 4: Unbridled excitement!
- Step 5: All the ROI: Reduced costs, improved performance, security, etc.
Finding meaning in the data (and possibly life)
There’s a big difference between seeing more data on graphs and charts — and understanding what that data says about application delivery. It’s not enough to show an interface statistic or the number of bits on a colorful graph. Modern networks require an advanced solution to apply statistical analysis algorithms and appropriate machine learning models to the entire dataset to derive meaningful insight.
Kentik ingests all telemetry into the platform and performs essential activities such as data transformation and applying specific models to identify patterns, detect anomalies, find meaningful correlations, and make predictions.
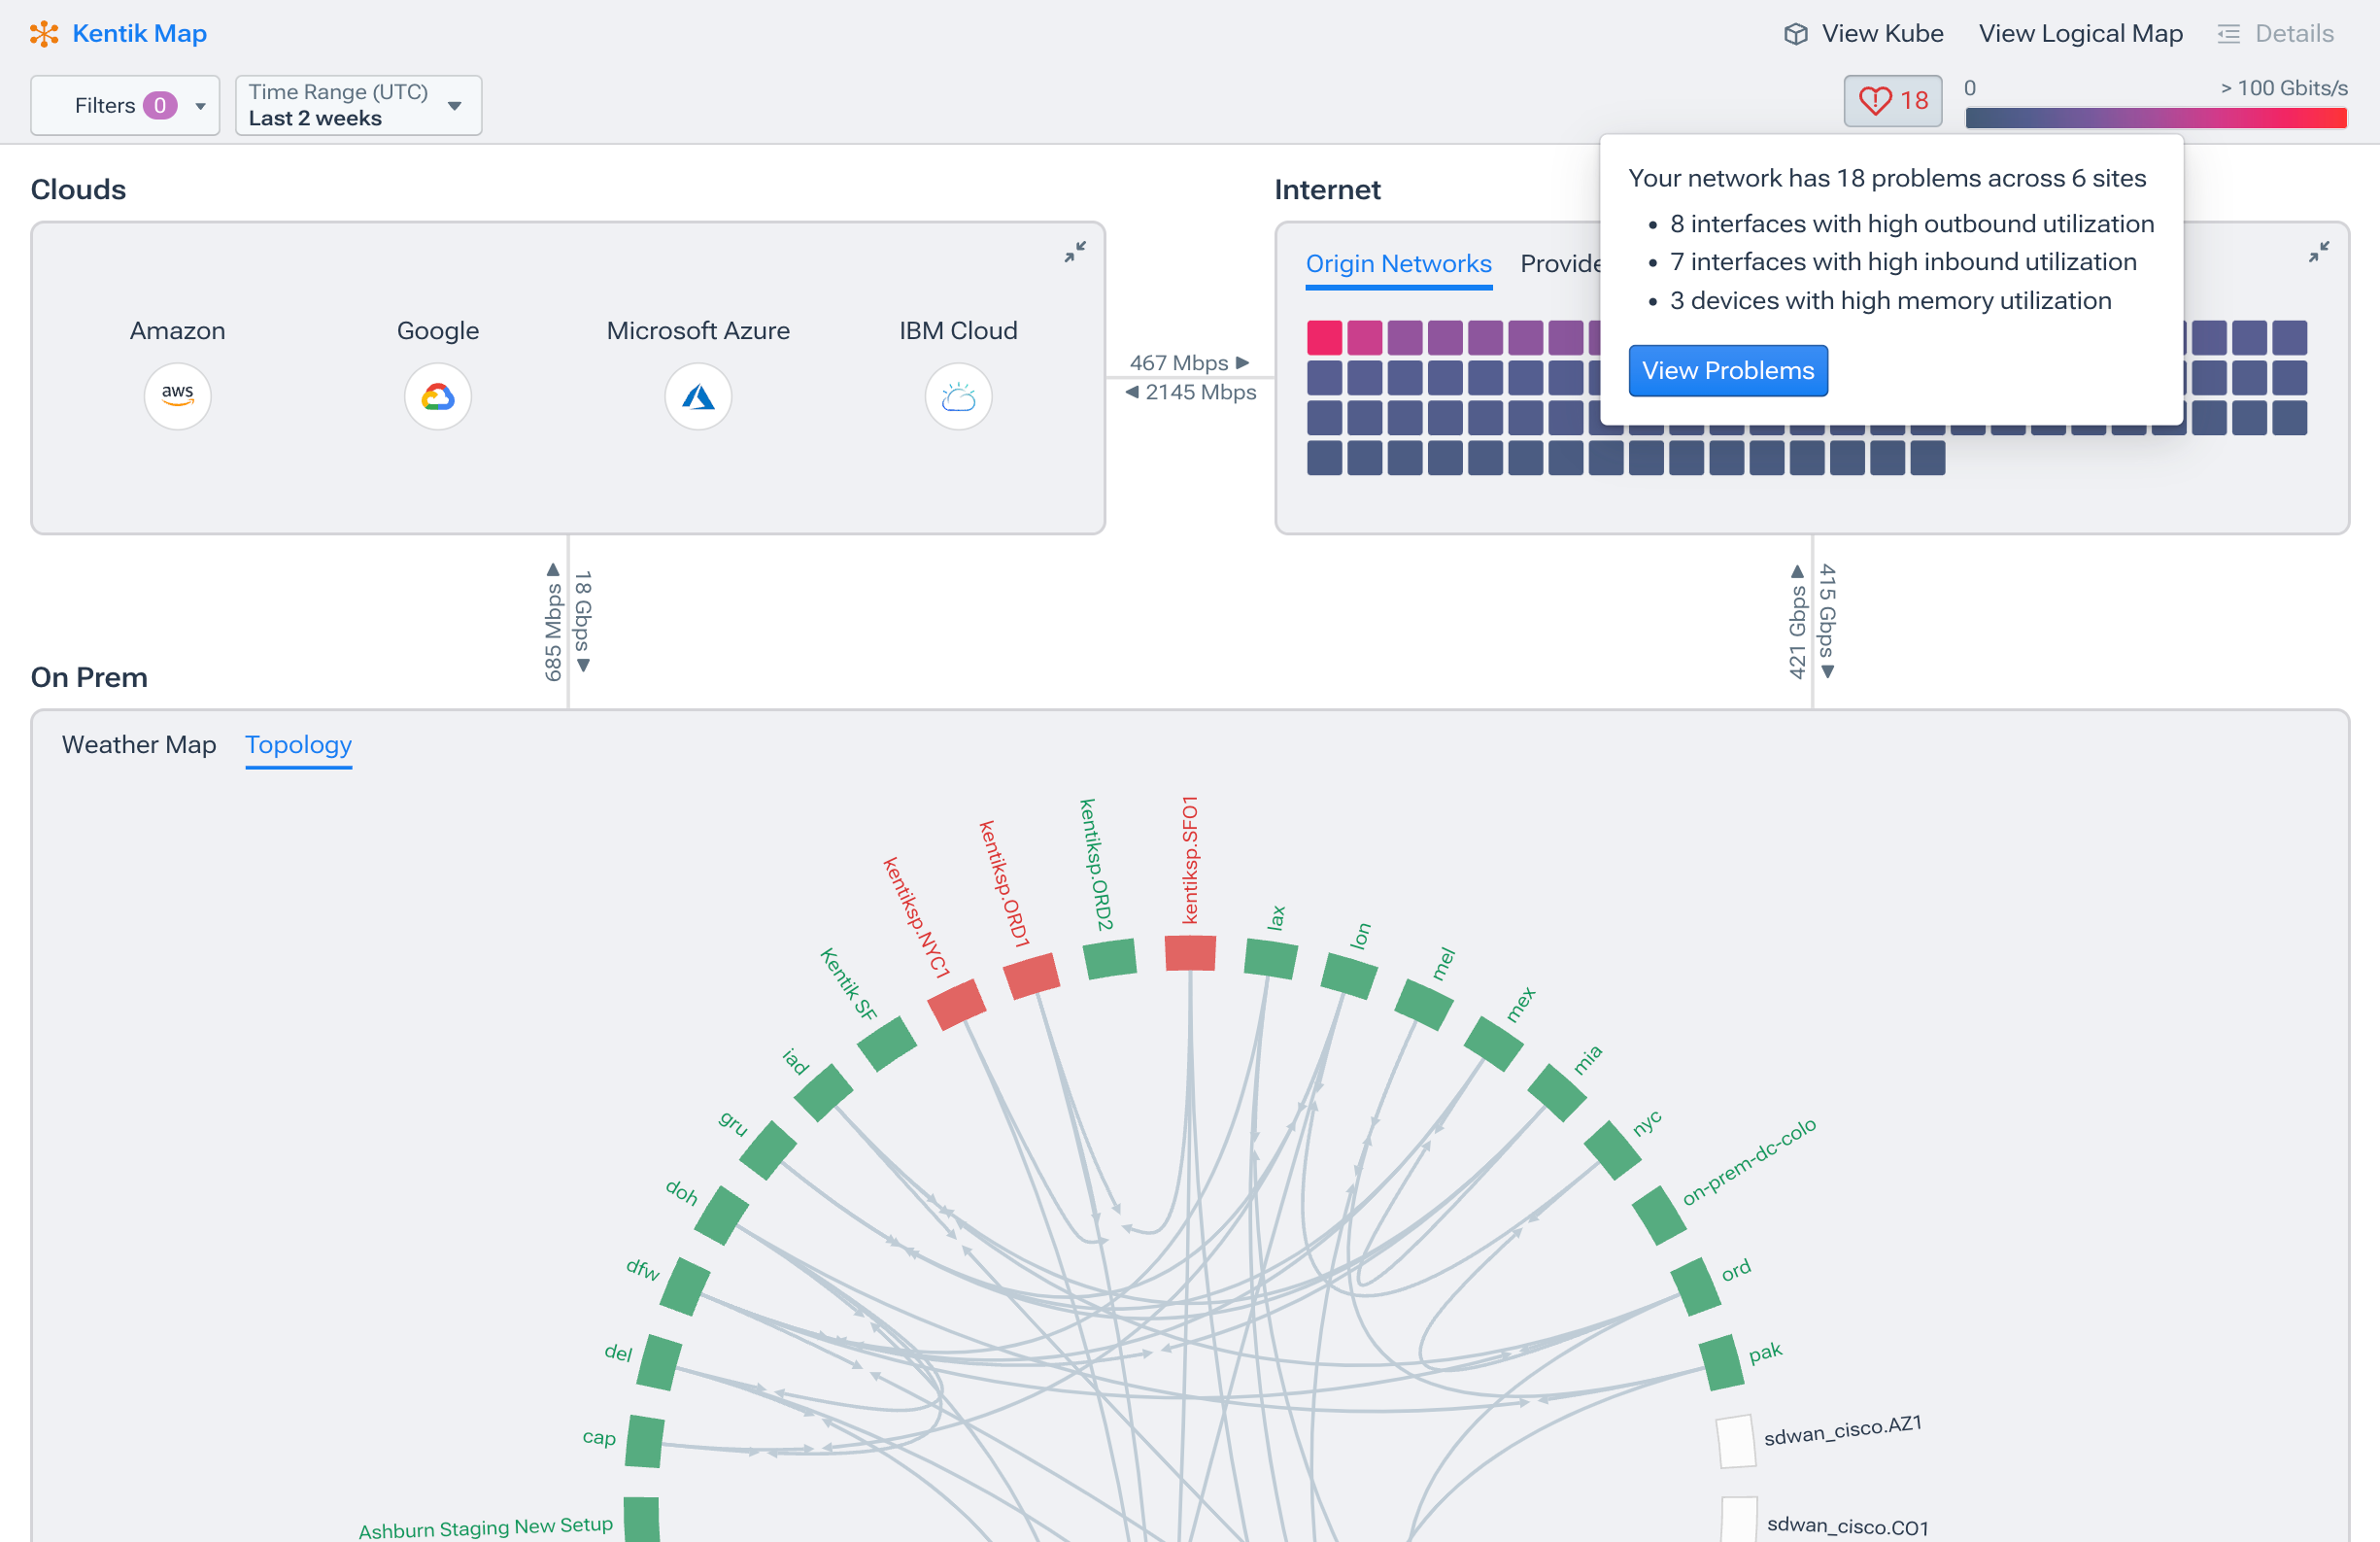
Kentik Insights, for example, provides unsolicited insight generated by the system that highlights what an engineer needs to pay attention to. That could be anything from an interface being unexpectedly overutilized after a configuration change, AWS costs trending upward after deploying a new DNS service, botnet activity detected in a given geo, and so on.
Legacy network performance monitoring tools struggle to parse and filter the data quickly enough for network teams to take action before customers are affected.
Enriching data with business context is good, right?
To truly understand application performance and delivery, we need more than just flows, SNMP information, streaming telemetry, etc. We need qualitative information that wraps the hard data in a business context. That way, engineers can understand more than just bits per second. Wouldn’t it be helpful to know how specific traffic patterns affect a monthly cloud bill, or how latency among containers in AWS relates to the performance of a particular application, for a specific end-user, in an exact location?
Kentik enriches its database with a cavalcade of additional information such as geographic identifiers, the global routing table, information from IPAM databases, container process identifiers, DNS server information, application, security tags, etc. We want to color our data with this additional context to aid in our understanding of why, not just what.
Something legacy NMS and NPM solutions seem to forget: Today’s applications are delivered primarily over the public internet. A visibility solution must provide data and insight into what’s happening with an application’s traffic traversing service provider networks. So, why do so many legacy visibility solutions avoid it altogether?
Kentik’s extensive work in global provider networks means that alongside internal flow, SNMP, streaming telemetry, and enrichment data is the entire global routing table, path traces between global cloud providers, metrics among ISP points of presence, and even peering information from sources such as PeeringDB.
Captain obvious alert: Today’s applications are delivered as SaaS apps or from public cloud resources. Applications rely entirely on the public internet, meaning having provider visibility is essential to modern network operations. (Not the thoughtiest leadership that’s ever been thoughted, but still a valid point.)
Why should you ditch your network tool
To quote famed network engineer Vanilla Ice in the 1991 classic Cool As Ice, “Drop that zero and get with the hero.”

Is that perhaps a bit much? Yes. But it’s so hard to find a relevant Vanilla Ice quote. Anything from Ice Ice Baby is too trite for a professional blog post (this loosely falls under that category), and “Go ninja, go ninja, go!” is painfully jaunty and completely asinine, and I don’t think I can make it work even with a desperate shout out to Robert Griesemer, Rob Pike, and Kent Thompson.
So, who are the heroes in this poorly chosen analogy? The Kentik product and engineering teams! As I write this, I’m singing the loudest Joe Esposito I can muster.
You know the song. That one.
Enough asides: Kentik was built from the ground up, from its very inception, as a network observability platform. From the beginning, the goal was (and is) to collect more data than the day before, find more types of telemetry to add to the dataset, and refine the insight derived from a unified data repository.
It seems obvious after looking at the myriad ways legacy NPM and NMS tools have struggled to modernize alongside network infrastructure. Kentik is a modern network observability solution created in the SaaS/big data era, made for today’s network.
The Legacy NPM and NMS tools used (and, dare I say, not loved) by many of today’s network teams are an outdated suite of point solutions bundled together for how engineers used to work.
What you should do now
- Tell Kentik’s CEO, Avi Freedman, that this blog post was a good idea, and not a very, very bad idea.
- Sign up for a Kentik demo.
- Listen to the Karate Kid soundtrack (but only briefly).

