How Kentik Detect & nProbe Monitor Your Network Performance

Summary
Network performance is mission-critical for digital business, but traditional NPM tools provide only a limited, siloed view of how performance impacts application quality and user experience. Solutions Engineer Eric Graham explains how Kentik NPM uses lightweight distributed host agents to integrate performance metrics into Kentik Detect, enabling real-time performance monitoring and response without expensive centralized appliances.
Network Performance Monitoring with Kentik Detect and nProbe
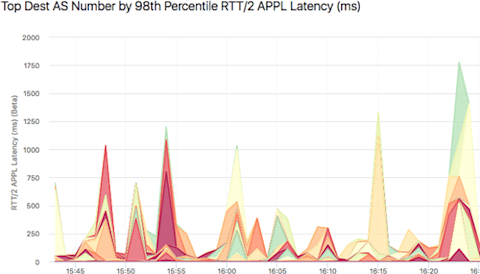
In the era of digital business, network performance is a critical aspect of keeping customers, subscribers, partners, and users happy. Can your customers complete transactions readily, or are you unintentionally pushing them toward your competitors? Are your employees able to complete their tasks without delay, or left idle waiting for “the system” to catch up? It’s up to IT and network engineering groups to address performance, but to do so they need effective ways to measure and monitor. They need to be able to see when performance is impacting user experience, service, or application quality so that they can respond with proactive or preventative steps.
At a high level, aspects of network performance monitoring functions are already available in many of the tools that are commonly embedded within the network infrastructure. For example, using SNMP or flow data to track traffic volume on interfaces, servers, and devices can provide necessary visibility into possible congestion points. Most network teams have some type of tool that can collect and display this information.
Nevertheless, the networking world is behind in understanding actual user performance because network devices, for the most part, only report traffic volumes. What’s been missing, until now, is the ability to look at actual packets to assess network health and track performance at the host level — without collecting and sifting through cumbersome and expensive full-packet captures. In this post we’ll talk about using Kentik’s NPM solution to watch the TCP performance of traffic as reported to Kentik Detect from a Kentik nProbe host agent. As an example, we’ll use traffic from Kentik’s own servers.
TCP is the key
To gather the metrics required to truly understand performance, a monitoring tool must look at one of the most important and widely used layers in the OSI model: transport. Specifically TCP, which is used in over 90% of network transactions. The Transport layer is important because TCP visibility can give you reliable, detailed insight into network performance. TCP was designed as a stateful protocol to provide reliability across network infrastructure. This is accomplished by using acknowledgements, sequence numbers, and the ability to retransmit data to ensure packets reach their destination. If the sending side does not receive an acknowledgment, the packet can be retransmitted or the TCP/IP connection closed. One key measure of performance — retransmit rate — starts to increase when packets are delayed or dropped due to network congestion or other network problems.
In the past, network engineers would need to use Wireshark to find TCP-related information within packet-capture files, which is a lengthy, time-consuming process. Or they would use expensive packet streaming/inspection appliances, which are difficult to deploy in any quantity without significant capital resources. The industry has also played with synthetic transaction alternatives, but those never really took off because to truly understand what’s going on you need to be able to look at real traffic.
While traditional NPM tools remain stuck in the era of centralized applications that can be monitored with monolithic appliances, IT as a whole has largely shifted to new approaches that distribute applications across the cloud, leaving gaps in what old-school NPM tools could see. As network traffic continues to grow, network engineers have struggled to maintain effective performance monitoring without affordable, comprehensive solutions.
Modern network performance monitoring
At Kentik, we see the trend toward distributed applications as both an opportunity and a model. We start with a cloud-scale analytics engine — Kentik Detect — that is powered by a distributed post-Hadoop big Data backend and runs a time-series database that is optimized for network data such as NetFlow and BGP. That enables us to ingest traffic data at massive scale, retain unsummarized details for months, and provide real-time answers to ad-hoc queries across billions of records.

For the NPM use case, we augment Kentik Detect with Kentik nProbe agent software that we’ve jointly developed with ntop, a leading provider of network visibility tools and technology, and that Kentik NPM customers can easily deploy on their hosts. Kentik nProbe inspects packets, creates augmented flow records, and sends them to Kentik Detect for continuous analytics processing in parallel with other flow data sources in the environment.
The Kentik NPM combination enables network engineers, operators, and managers to capture, visualize, and analyze performance metrics (listed in the metrics menu, at right, from the Kentik Detect portal) in real time and within the context of the entire network infrastructure. And it enables them to easily pivot between traffic volumetrics and performance analysis to better diagnose issues and fix the root causes. With Kentik NPM, network performance monitoring moves into the modern age.
Seeing performance in context
The TCP-based metrics that the nProbe host agent adds to Kentik Detect give operators the visibility to proactively recognize and troubleshoot network performance problems. These metrics include: retransmits, out-of-order packets, fragments, and even server/client/application latency statistics. Kentik Detect unifies this data — along with flow data from non-host devices such as routers and switches — into a time series database that correlates flows with geolocation (Country, Region, City), SNMP (interface level descriptions), and BGP routing information.
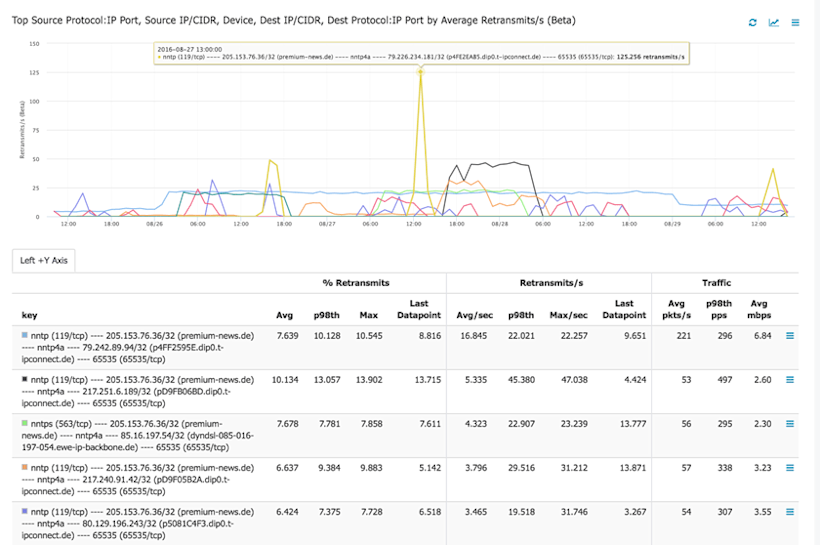
Using Kentik Detect for NPM, traffic statistics can be correlated using basic 5-tuple TCP/IP information and visualizations can show the performance for grouped objects as well as where traffic is coming from and going to. Operators can quickly visualize flow data to determine what protocol and ports, IP-to-IP conversations, devices, device interfaces, BGP routes, and Autonomous System Numbers are active, combining up to eight dimensions at a time to understand where performance is a problem. The following graph, for example, is a multi-dimensional traffic flow diagram using nProbe host agent data.
Kentik NPM use case
We use Kentik Detect’s NPM capabilities internally at Kentik to troubleshoot network performance. If we didn’t have nProbe to provide host data, we would instead have to use packet captures and detailed pcap analysis. The following looks at one example of how we have used Kentik NPM.
Situation: Measuring kernel retransmits on some of our flow ingest servers, we saw that several of the servers indicated a high number of retransmits, but we didn’t have any TCP/IP detail to understand or correct the problem. We were also observing slow response times from applications running on the server. Our Operations team initially assumed that the problem was caused by external users and Internet-sourced traffic, but with no detail we couldn’t be certain.
Resolution: We installed the nProbe host agent on the server and added it to our collection of devices exporting flow to Kentik Detect. On the Data Explorer page of the Kentik Detect portal, we were now able to look at the nProbe-provided metrics, and we quickly found some pretty serious issues on a group of internal destination hosts: retransmits of 4% or more on hosts doing greater than 100 pps, as well as long latency. While these retransmits were minimal compared to overall traffic, they were significant to a critical microservice.
Drilling into the performance statistics, we saw that the issues were all on hosts sitting behind switch interfaces that were converting 1G to 10G. We were then able to identify the root cause, which was a switch with shallow (or broken) buffers. We were already planning to upgrade the physical interfaces on these servers to 10G, and were able to accelerate the 10G upgrade to correct the problem.
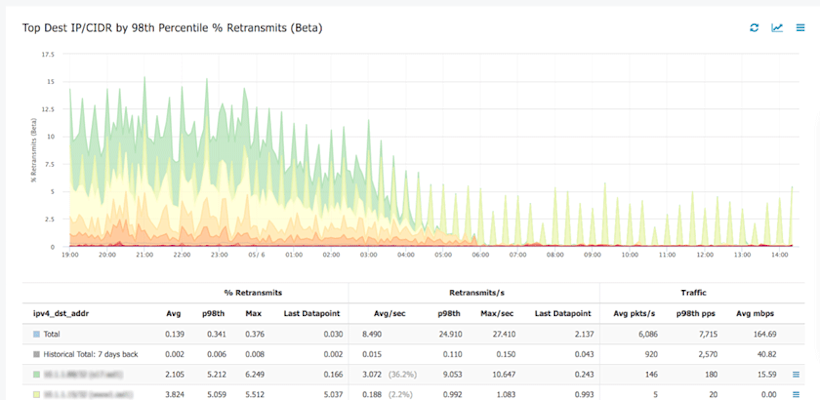
The following graph plots retransmits for all /32 destination hosts on the day of the 10G upgrade, showing a pretty dramatic improvement from beginning to end.
While the use case discussed here may seem simple, when you’re managing hundreds of servers, it makes a huge difference to have the ability to look at performance and quickly drill into the problem without deploying hardware probes and analyzing pcap data.
What next?
The Kentik nProbe host agent can be deployed today by downloading the nProbe software and installing it on servers (see Host Configuration in the Kentik Knowledge Base). No nProbe license is necessary if you use the startup flags that send resulting flow records directly to Kentik’s back end. You will need a device license in Kentik Detect, but you can get started and try it out for 30 days at no charge.
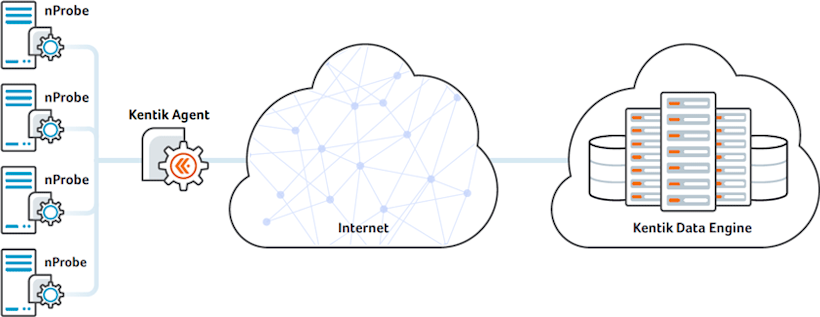
The interesting thing about the nProbe technology is that it can operate in several modes, and can serve a number of different functions. For example, you could install nProbe on a dedicated server and send that server a copy of network packet streams, via tap or SPAN. One of our current Kentik Detect users is already trying this out. We call this “sensor mode” and it is, essentially, a much more cost-effective alternative to the packet inspection instrumentation appliances that are available in the market today. More on that soon - stay tuned!
In the meantime, you can sign up for Kentik Detect in 15 minutes and begin to experience the power of Kentik’s Big Data NetFlow analysis, network performance monitoring, and DDoS detection. Start your free trial today and let us know what you think at @kentikinc or info@kentik.com.


