Network Latency: Understanding the Impact of Latency on Network Performance
Network performance is essential for any organization relying on online services or connected technologies. From supporting business operations to ensuring seamless user experiences, a network’s efficiency significantly impacts an enterprise’s overall functionality and productivity. This article aims to explain one critical aspect of network performance: network latency. It covers the fundamentals of network latency, how to measure it, its impact on performance, strategies to reduce it, and the tools for monitoring network latency.
Understanding Network Latency
Let’s take a look at what network latency is, the different forms it takes, and how it can affect the overall performance of a network.
What is Network Latency?
Network latency, or simply “latency,” represents the time delay during data transmission over a network. This delay, or lag, is often measured in milliseconds and is influenced by various factors, including the physical distance between devices, network congestion, hardware and software limitations, and the protocol used for data transmission. A network with low latency ensures faster data transfer, which is crucial for businesses aiming to boost productivity and for applications that require high performance, such as real-time analytics and online gaming. High latency can decrease application performance and, in severe cases, can cause system failures. Managing and minimizing network latency is paramount in maintaining efficient and reliable network communications.
Network latency includes the delay from all the processes the data encounters as it moves through the network. Various factors influence network latency, and understanding these can help manage and optimize your network performance. Latency occurs in four main forms:
- Propagation latency: the time taken for data to travel between points.
- Serialization latency: time taken to convert data into a format suitable for transmission.
- Processing latency: time taken to process the data at various points.
- Queuing latency: the time the data waits in queues at various points along the route.

Latency, Packet Loss, and Jitter: Interconnected Network Performance Metrics
It’s essential to understand the significance and interdependence of latency, packet loss, and jitter when discussing network performance:
- Network Latency: Network latency is the delay in data communication over a network. High latency means data packets take longer to travel from the source to their intended destination. This delay can influence the efficiency of data-dependent applications, especially real-time services like VoIP or online gaming.
- Packet Loss: Packet loss is when data packets fail to reach their destination, which can occur due to network congestion, faulty hardware, or even software bugs. High packet loss can significantly degrade network performance and user experience, leading to a situation where the sender must retransmit the lost packets, inducing more latency.
- Network Jitter: Jitter refers to the variability in packet delay at the receiver. In simpler terms, if the delay (latency) between successive packets varies too much, it could impact the quality of the data stream, especially for real-time services like video streaming or VoIP calls.
These three metrics are interconnected and influence each other. For example, high latency can lead to an increase in jitter and high packet loss can lead to an increase in both latency and jitter. Understanding these metrics and their interdependence helps network administrators and NetOps professionals troubleshoot and improve network performance.
For a deeper understanding of these metrics and their impact on network performance, refer to our detailed guide on Latency, Packet Loss, and Jitter. Related insights can be found in the Kentik blog post “Why Latency is the New Outage.”
What Factors Affect Network Latency?
To understand how to effectively manage network latency, it is essential to look at the factors that influence it. These factors encompass physical infrastructure, bandwidth, traffic volume, and network protocols.
Physical Infrastructure
Physical infrastructure significantly influences network latency. The transmission medium (copper, fiber optics), quality of network hardware (routers, switches, firewalls), and physical distance between source and destination all impact the time it takes for data to travel.
Transmission Medium
The medium used for data transmission greatly affects the speed of data transfer. For instance, fiber optic cables offer significantly faster data transmission speeds than traditional copper cables, thereby reducing latency.
Network Hardware
The quality and capability of network hardware also play a critical role. Advanced, high-quality routers and switches can process and forward packets faster, reducing processing and queuing latency.
Distance
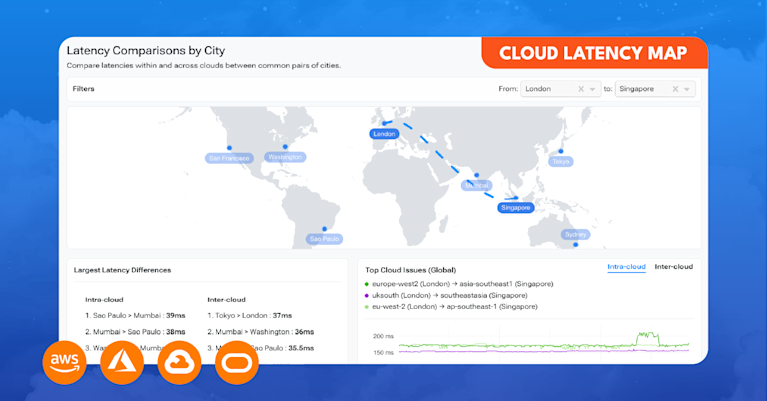
The physical distance data must travel between its source and destination impacts propagation latency. The farther the distance, the longer it takes for data to travel, thereby increasing latency.
Bandwidth
Bandwidth refers to the maximum amount of data that can be transmitted over a network path within a fixed amount of time. Limited bandwidth can lead to network congestion, particularly during peak usage times, as more data packets are trying to traverse the network than it can handle. This congestion can cause increased latency as packets must wait their turn to be processed and forwarded.
Traffic Volume
Similar to the impact of bandwidth, high traffic volume can congest network paths, increasing queuing latency. For example, a sudden surge in the number of users or an increase in the amount of data being sent over the network (like during a large file transfer) can slow down data transmission and increase latency.
Network Protocols
Network protocols determine how data packets are formed, addressed, transmitted, and received. Different protocols have different overheads, and some may require back-and-forth communication before data transmission, which can increase latency. For example, the Transmission Control Protocol (TCP) involves establishing a connection and confirming data receipt, contributing to higher latency than the User Datagram Protocol (UDP), which doesn’t require such processes.
Measuring Network Latency: Key Metrics and Tools
Accurately understanding and measuring network latency is essential for effective network management. There are several vital metrics used in the measurement of network latency:
-
Round-Trip Time (RTT): Round-trip time refers to the total time it takes for a signal to travel from the source to the destination and back again. RTT is an essential metric because it provides an understanding of the responsiveness of a network connection.
-
Time-to-Live (TTL): TTL, initially designed to prevent data packets from circulating indefinitely, is a value in an Internet Protocol (IP) packet. It indicates to a network router whether the packet has been in the network for too long and should be discarded. In terms of latency, TTL can hint at how many hops a packet can make before it’s discarded, indirectly revealing potential latency in a network.
-
Hop Count: This metric signifies the number of intermediate devices, such as routers, that a data packet must pass through to reach its destination. A higher hop count can often signal increased latency due to the added time taken for each hop.
-
Jitter: Jitter quantifies the variability in latency. It reflects the changes in the amount of time it takes for a piece of data to move from its source to a destination. In a stable network, data packets arrive at consistent intervals, resulting in low jitter. However, high jitter can lead to packet loss and interrupted service due to inconsistent data packet arrivals.
Alongside these critical metrics, there is a range of tools available to measure network latency, each offering its unique insights:
-
Ping: This command-line tool measures the round-trip time for messages sent from the originating host to a destination computer. It measures the total time a data packet takes to travel from the source to the destination and back, providing an immediate view of the current latency between the two points.
-
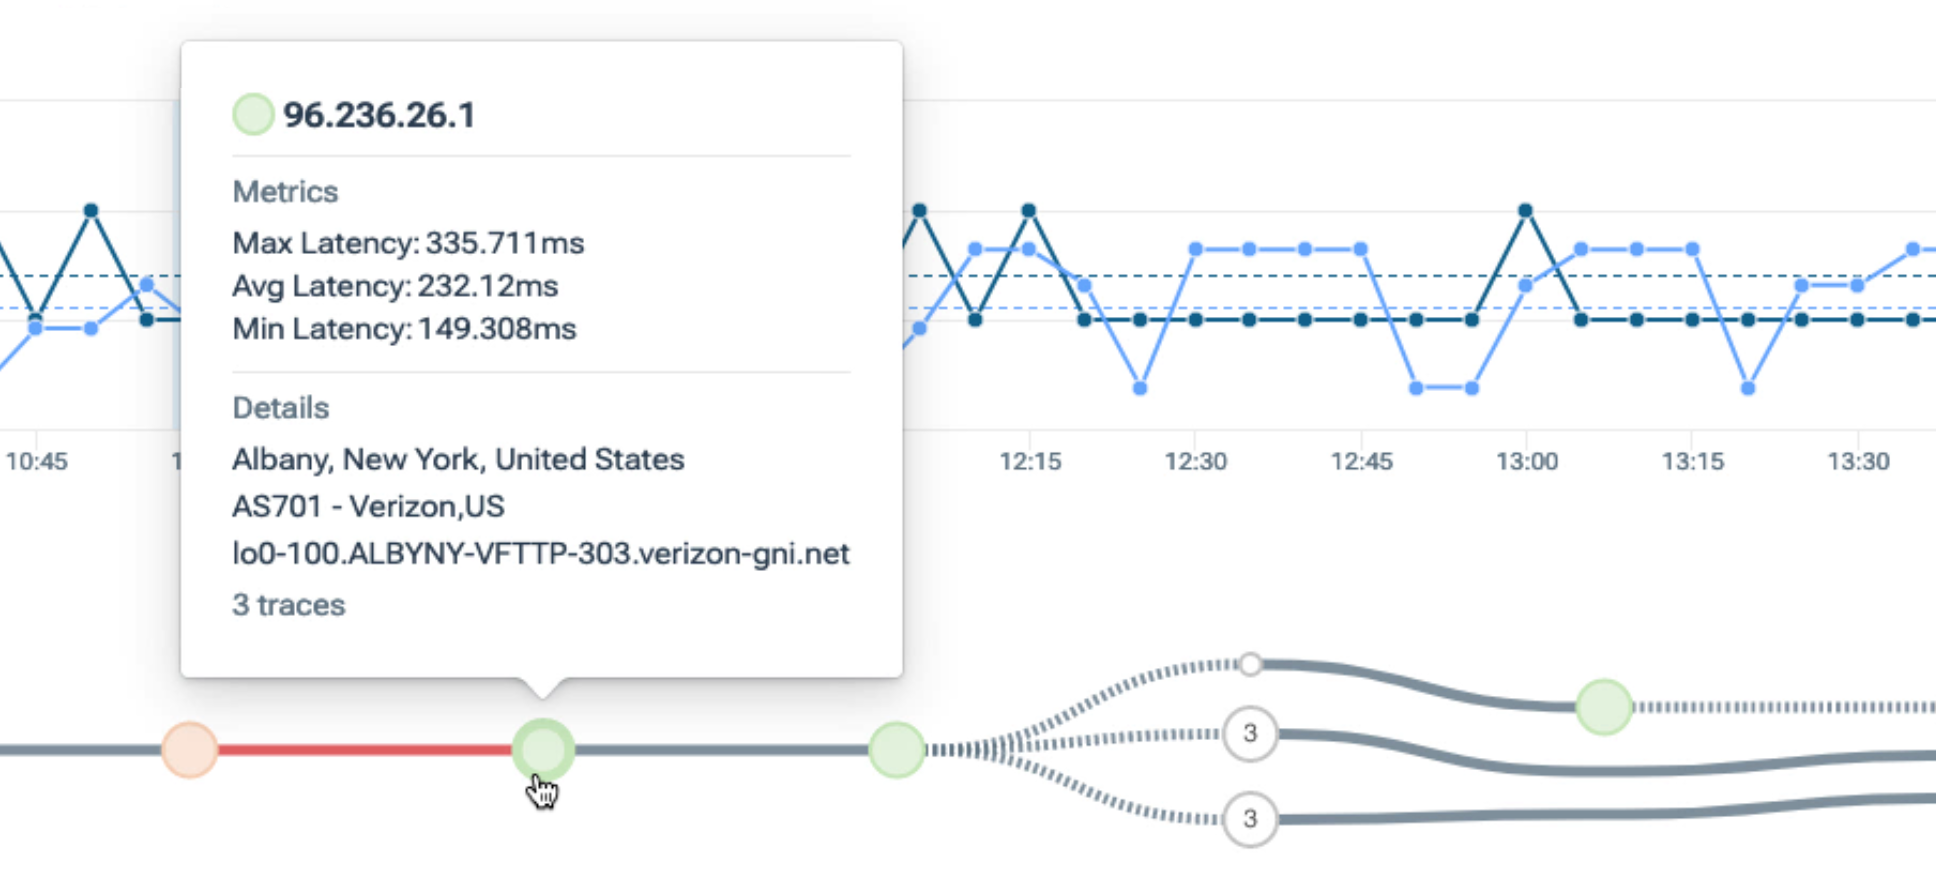
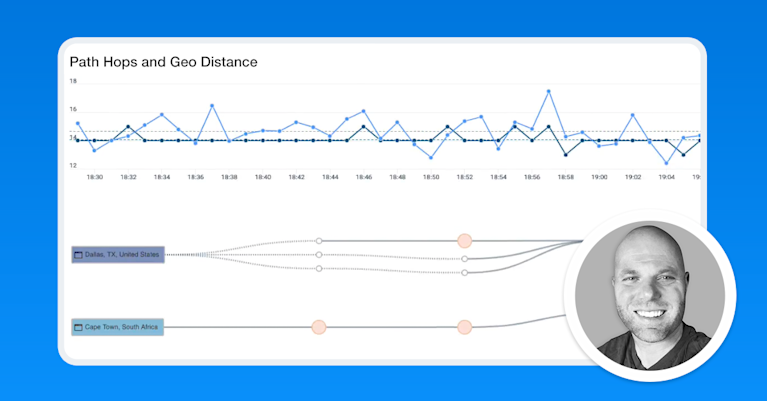
Traceroute: Traceroute, another command-line tool, identifies the path that a data packet takes from the source to the destination and records the time taken at each hop. This tool allows users to visualize the packet’s journey, identify where potential delays might occur, and thus diagnose the source of high latency.
-
MTR: MTR (My Traceroute, initially named Matt’s Traceroute) combines the functionality of the traceroute and ping programs in a single network diagnostic tool. MTR probes routers en route to a destination IP address and sends a sequence of pings to each of these routers to measure the quality of the path (latency and packet loss).
-
Online Latency Testing Tools: These web-based tools allow users to measure network latency without needing command-line knowledge. Examples include Speedtest by Ookla and Ping-test.net. These user-friendly tools provide visual and easy-to-understand representations of latency and other network metrics.
-
Open-Source Tools: A wide range of open-source tools are available for more detailed and specific data on network latency. These tools, like Wireshark for detailed network protocol analysis and Grafana for metric visualization, offer an in-depth view of network performance, which can be tailored to specific user needs.
-
Network Observability Solutions: Advanced network observability platforms like Kentik provide an automated way to monitor and manage network performance metrics, including latency, packet loss, jitter, and hop count. With synthetic testing, Kentik can automate these measures across multiple locations, enriching data with additional network context such as flows, BGP routes, and autonomous systems (AS). This level of automation and contextual information allows for a more accurate representation of user experience and proactive network troubleshooting.
Understanding these key metrics and leveraging the appropriate tools are fundamental to accurately measuring and improving network latency. Comprehensive latency measurements help organizations optimize network performance, ensure seamless user experience, and enhance business operations.
The Impact of Latency on Network Performance
Network latency significantly influences network performance, often manifesting in multiple ways:
-
Slow Response Time: High latency slows down the response time of applications, leading to frustrating user experiences, especially for time-sensitive applications like video conferencing or online gaming.
-
Reduced Throughput: Higher latency can cause reduced data transfer speed or throughput. This decrease is especially problematic for data-intensive applications and services.
-
Poor User Experience: High network latency can lead to lag or delay in user interactions, diminishing the overall user experience. In today’s fast-paced digital world, user expectations for immediate responses are high.
-
Increased Buffering: For video streaming services, high network latency leads to more buffering and lower quality streams, frustrating users and potentially leading to user churn.
-
Lower Efficiency: Latency impacts the efficiency of network communications, slowing down data transfers and making the network less capable of handling high traffic volumes.
-
Impaired Cloud Services: For cloud-based applications and services, high latency can mean slower access to data and applications, impairing business processes and productivity.
Specific applications like Voice over Internet Protocol (VoIP), video streaming, and online gaming are particularly sensitive to network latency. Any delays can significantly degrade the quality of calls, streams, or gameplay, impacting user satisfaction and potentially leading to customer loss.
Strategies for Reducing Network Latency
There are various strategies for reducing network latency. These strategies and robust network hardware play a crucial role in enhancing user experience and improving application performance.
Content Delivery Networks (CDNs)
CDNs are a powerful tool for reducing network latency. They work by storing copies of web content on multiple servers distributed across various geographical locations. When a user makes a request, the content is delivered from the server closest to the user, thereby reducing latency.
Network Optimization Techniques
Several network optimization techniques can also help reduce latency:
- Caching: Storing data in temporary storage (cache) to serve future requests faster, reducing the need for data to travel across the network.
- Compression: Reducing the size of data that needs to be transferred across the network, thereby reducing the time taken.
- Minification: Removing unnecessary characters from code to reduce its size and speed up network transfers.
Protocol Optimizations
Certain protocol optimizations can reduce latency:
- TCP optimizations: Transmission Control Protocol (TCP) optimizations, such as selective acknowledgments and window scaling, can help improve network performance and reduce latency.
- UDP vs. TCP for real-time applications: For real-time applications, using User Datagram Protocol (UDP) instead of TCP can lower latency. Unlike TCP, UDP doesn’t require the receiving system to send acknowledgments, reducing delay.
Server and Infrastructure Considerations
Careful planning and management of server locations and network infrastructure can help reduce latency:
- Server location and proximity to users: Placing servers close to the end-users can significantly reduce the distance data has to travel, thereby reducing latency.
- Bandwidth and capacity planning: Ensuring adequate network capacity and managing bandwidth effectively can help prevent network congestion, a common cause of increased latency.
Latency and its Impact on TCP vs UDP
Network performance can be significantly influenced by the protocols used for data transmission. Two of the most commonly used protocols are the Transmission Control Protocol (TCP) and the User Datagram Protocol (UDP), each offering distinct advantages and differing in their reaction to latency.
TCP vs UDP: Dealing with Latency
TCP is a connection-oriented protocol that meticulously establishes a reliable data channel before data transmission occurs. It ensures the accurate and orderly delivery of data packets by waiting for acknowledgments from the receiving end before sending additional packets. TCP’s performance can be adversely affected in situations with high latency as it may have to wait longer for these acknowledgments. Worse still, if acknowledgments take too long, TCP might resort to retransmitting packets, potentially causing redundant data traffic and further degradation in performance.
UDP, in contrast, is a connectionless protocol. It rapidly sends data without ensuring its arrival at the destination, effectively indifferent to whether or not the packets are being received. As such, UDP is not influenced by latency in the same way as TCP. This makes UDP ideal for real-time applications like streaming and gaming, where speed is prized over flawless data delivery.
Understanding the TCP Window Effect
The TCP window size is a pivotal factor in determining the volume of data that can be concurrently in transit. This “window” essentially represents the quantity of unacknowledged data that can be “in flight” at any given time. High latency conditions can impede the sender as it might have to pause and wait for acknowledgments before it can transmit more data, effectively reducing the bandwidth of the connection — a concept known as the “bandwidth-delay product.”
This phenomenon is the TCP window effect, where throughput is constrained by high latency. To achieve maximum throughput, the window size should be large enough to encompass all data that can be transmitted during the round-trip time (RTT), also referred to as the “pipe size.” If the window size is too small, the sender will be left waiting for acknowledgments, leading to lower throughput.
In cases where the maximum window size is insufficient for optimal performance under high latency conditions, TCP window scaling can be used. Window scaling is a mechanism used to increase the maximum possible window size from 65,535 bytes (the maximum value of a 16-bit field) to a much larger value, allowing more data to be “in flight” and thus improving throughput on high-latency networks.
What are Selective Acknowledgments (SACKs)?
This is where Selective Acknowledgments (SACKs) become crucial. SACKs are a mechanism designed to overcome these challenges by acknowledging non-consecutive data segments. However, even with SACKs, waiting for them in a high-latency environment can still hamper throughput.
By understanding these phenomena and taking advantage of mechanisms like SACKs and window scaling, network engineers can better diagnose and resolve network issues related to latency and throughput.
Proactive Latency Management: Synthetic Monitoring
Synthetic monitoring plays a crucial role in proactive network latency management. It involves using software to simulate user behavior and monitor the performance and availability of web-based applications and services.
Synthetic monitoring provides a host of benefits. It allows for historical data collection and proactive troubleshooting, enabling IT teams to identify and resolve network issues before they impact users. Furthermore, synthetic monitoring can verify network SLAs and measure the impact of network changes or updates.

Kentik offers a synthetic monitoring solution that automates these tests, providing several advantages:
- Running tests from multiple locations: Kentik’s solution can run tests against the same destinations from dozens of different locations, providing a more comprehensive picture of network performance.
- Enriched data: Kentik enhances synthetic monitoring data with additional information, such as flows, BGP routes, and Autonomous Systems (AS), providing greater context for the test results.
- Context-specific testing: By using enriched data, tests can be run against specific IP addresses from selected locations. This ensures that the test results accurately represent the user base and network performance.
Kentik Tools for Monitoring Network Latency
Accurate measurement and monitoring of network latency are essential for maintaining optimal network performance. Continuous monitoring using automated network performance management solutions helps identify potential bottlenecks and performance issues in real time. Network observability and Network Performance Monitoring (NPM) tools play a crucial role in this process. These tools provide real-time visibility into network performance, track performance trends, and enable proactive issue resolution.
Kentik offers a suite of advanced network monitoring solutions designed for today’s complex, multicloud network environments. The Kentik Network Observability Platform empowers network pros to monitor, run and troubleshoot all of their networks, from on-premises to the cloud. Kentik’s network monitoring solution addresses all three pillars of modern network monitoring, delivering visibility into network flow, powerful synthetic testing capabilities, and monitoring of all types of network device metrics — such as latency, throughput, bandwidth — with Kentik NMS, the next-generation network monitoring system.
To learn how Kentik can bring the benefits of network observability to your organization, request a demo or sign up for a free trial today.


