Network Monitoring: Ensuring Optimal Network Health and Performance
Network monitoring has evolved from its humble beginnings as a basic troubleshooting tool utilizing Internet Protocol (IP) to a sophisticated system essential for maintaining optimal network health and performance. Understanding and managing their complexities becomes crucial as networks grow in complexity due to digital transformation, IoT, cloud migration, and Software as a Service (SaaS) platforms. This article provides an overview of network monitoring, highlighting its significance, techniques, challenges, and future.
What is Network Monitoring?
Network monitoring is the systematic oversight of a computer network’s health and performance. Using specialized software or services, it proactively detects issues like slow traffic and component failures. Analyzing real-time network data helps administrators pinpoint potential problems, ensuring optimal network operation.
Beyond offering immediate alerts, comprehensive network monitoring tools provide an overview of the network’s topology and interconnected components. These visualizations, including the flow of packets and NetFlow data, help network administrators make timely interventions and data-driven decisions to improve network reliability and efficiency.
In this short video, Kentik technology evangelist Leon Adato explains the basics of network monitoring and the three technology pillars of modern network montioring.
The Evolution of Network Monitoring
The concept of network monitoring isn’t new. Early networks used basic tools like the ping command, which operates on the Internet Control Message Protocol (ICMP), to check the reachability of devices. However, as networks grew in size and complexity, so did the tools designed to monitor them, incorporating technologies like SNMP (Simple Network Management Protocol), NetFlow, and IPFIX.
The advent of the internet, TCP connections, and cloud computing brought new challenges. Traditional networks, which were limited to a company’s physical premises, expanded to include multiple locations, cloud environments, container networking, and even global infrastructures. This expansion called for more sophisticated monitoring methods to understand these complex environments.
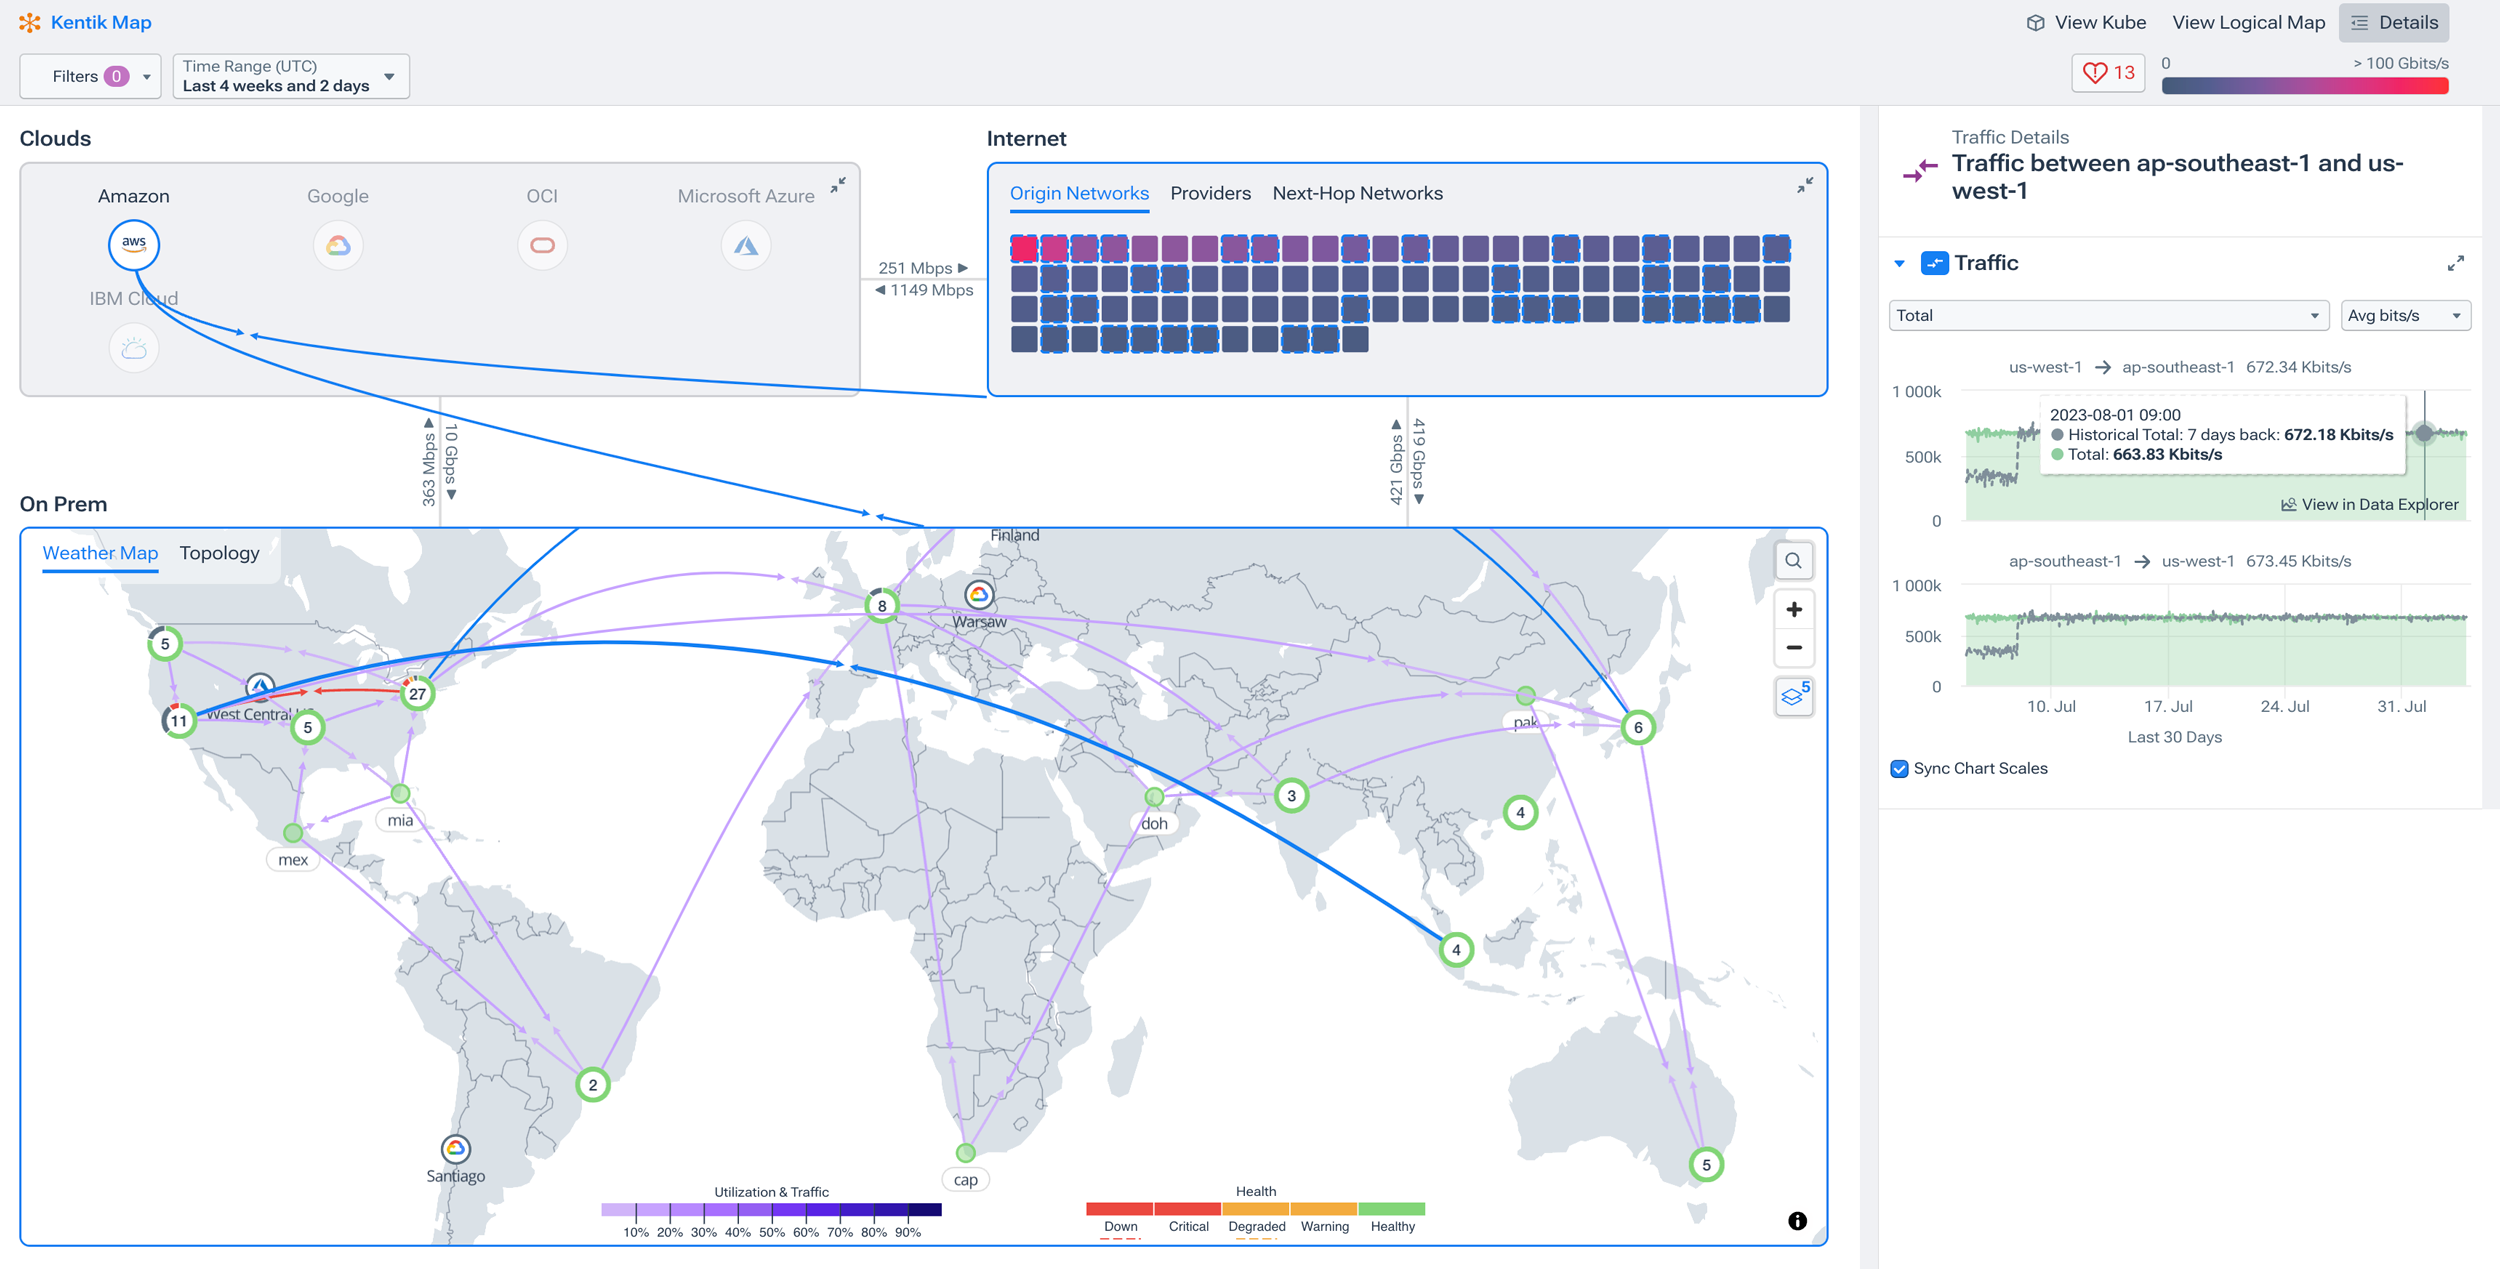
Modern network performance monitoring metrics go beyond simple up-down checks. They include granular performance details, ensuring that every aspect of the network performs at its best, from bandwidth to latency.
Three Pillars of Modern Network Monitoring
Network monitoring is a complex and evolving field and today’s modern network monitoring tools can be grouped into three “pillars”: Traffic Analysis, Synthetic Testing, and Network Infrastructure Metrics. In a holistic approach to network monitoring, each of these three monitoring technologies offers specific capabilities to ensure the health, performance, security, and reliability of modern networks. Modern network monitoring solutions like Kentik incorporate all of these components, offering an alternative to siloed, legacy tools.
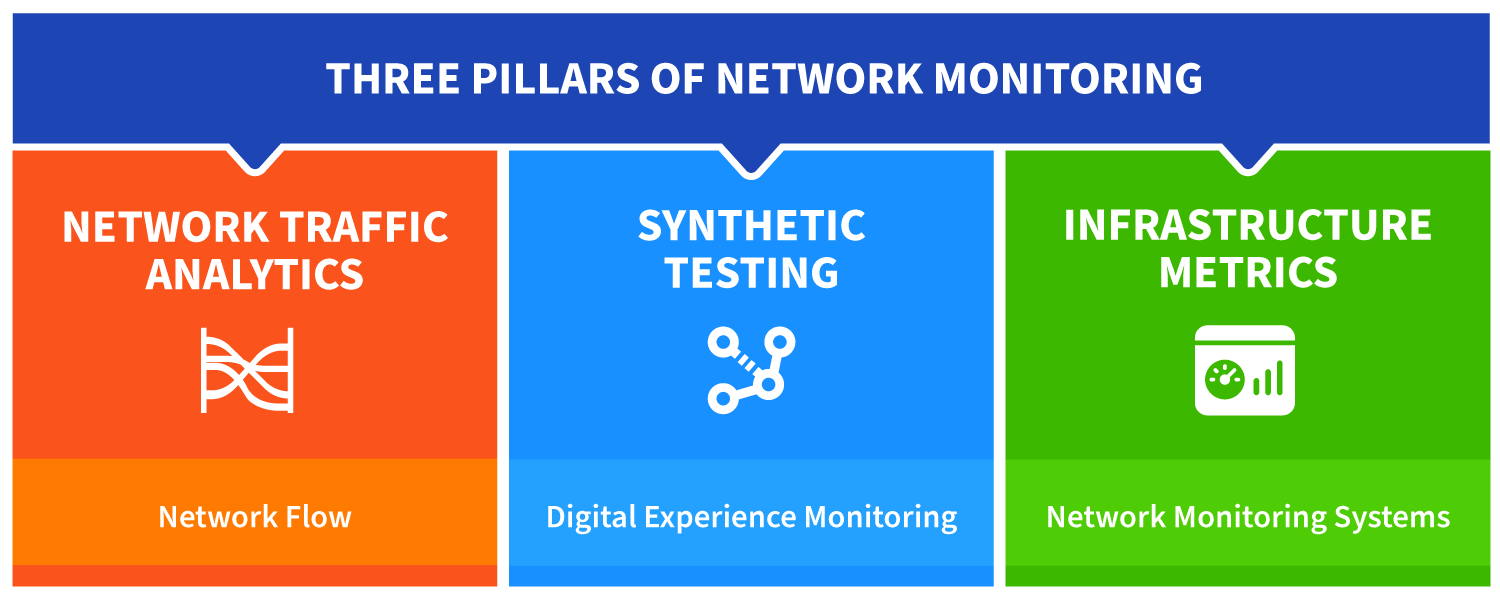
Network Traffic Analysis (Flow Analysis)
The first pillar, Network Traffic Analysis (also known as NTA or Flow Analysis), involves passively monitoring network traffic, typically represented by network flow data. This approach offers granular insights into real-world network usage and is critical to understanding network dynamics.
-
Data Sources: NTA uses flow records, such as those from NetFlow protocols, VPC flow logs from cloud services, and packet traces via Deep Packet Inspection (DPI).
-
Event Analysis: NTA captures and analyzes network events and changes through log records.
-
Pros of Network Traffic Analysis:
- Provides a detailed view of actual network usage.
- Offers insights into network performance and user behavior.
- Essential for detecting anomalies and potential security threats, such as DDoS attacks.
-
Cons of Network Traffic Analysis:
- Primarily limited to existing traffic flow.
- May not provide immediate, real-time data.
- Can be data-intensive, requiring effective data management strategies if deployed on-premises.
Synthetic Testing (Digital Experience Monitoring - DEM)
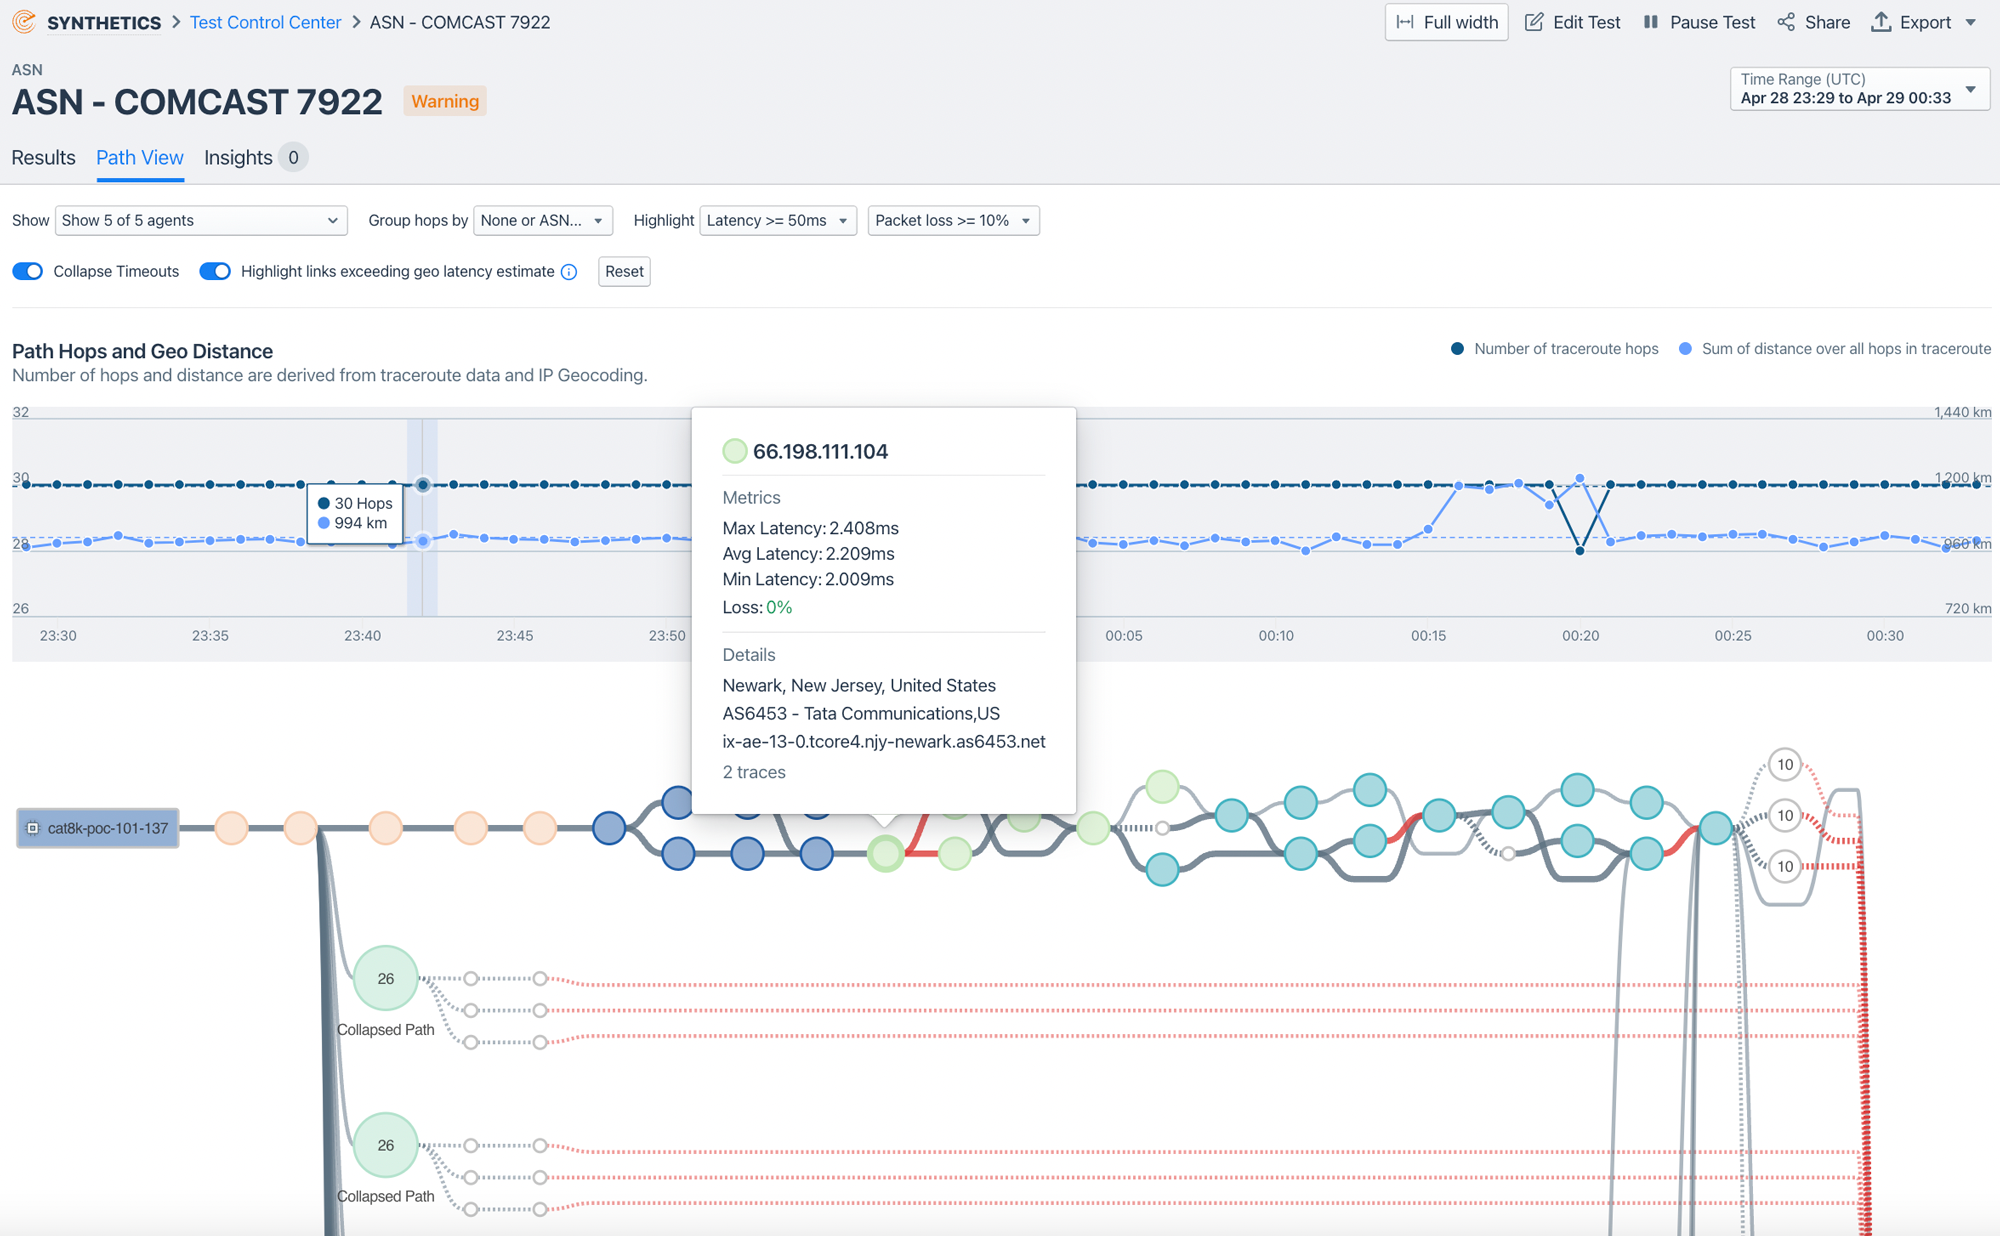
The second pillar of modern network monitoring, Synthetic Testing, is a proactive approach that tests network functions to emulate real user experiences. A primary goal of synthetic testing is to anticipate and mitigate performance issues before they impact actual users. Synthetic testing is part of the broader discipline of Digital Experience Monitoring (DEM).
- Testing and Data: Synthetic testing involves creating scenarios that mimic user actions to collect data on network responses and performance. Tests are typically performed auotmatically and at regular intervals.
- User-Centric Focus: This technology aims to predict how the network will perform under various user conditions.
- Pros of Synthetic Testing:
- Identifies potential issues from an end-user perspective before they impact actual users.
- Allows for frequent, regular, and automated testing, enhancing preparedness.
- Assists in capacity planning and optimizing user experience.
- Cons of Synthetic Testing:
- Limited to the specific targets and scenarios set up for testing.
- May not capture all real-world conditions or spontaneous/anomalous network events.
- Requires careful scenario design to ensure the relevance and accuracy of each test.
Network Infrastructure Metrics (Network Monitoring Systems - NMS)
The final pillar, Network Infrastructure Metrics, often managed through Network Monitoring Systems (NMS), is about maintaining and optimizing the physical and virtual devices in a network.
- Monitoring Tools: NMS tools uses protocols such as SNMP, Streaming Telemetry, and other advanced monitoring technologies to collect network device health metrics such as up/down status, bandwidth usage, memory consumption, and CPU utilization.
- Event Handling: Includes mechanisms like SNMP Traps for real-time alerts on network conditions.
- Pros of Network Infrastructure Metrics:
- Provides direct insights into the health and status of network devices.
- Essential for preventative maintenance and rapid issue resolution.
- Facilitates strategic planning for network upgrades and expansions.
- Cons of Network Infrastructure Metrics:
- May offer limited context regarding end-user experience or specific application performance.
- Requires integration of diverse monitoring tools for a comprehensive view in many cases.
- Protocols like SNMP require polling and not all network monitoring systems are capable of high-frequency polling or offer alternatives such as streaming telemetry.
In this short video, Kentik product manager Chris O’Brien gives Packet Pushers host Ethan Banks an overview of Kentik’s network monitoring system, discussing the how collecting network infrastructure metrics via SNMP polling differs from the more real-time nature of streaming telemetry. They explore some of the benefits and challenges of both approaches:
Why is Network Monitoring Important?
The importance of network monitoring extends beyond mere oversight. In today’s hybrid-cloud, multicloud, and web application environments, a minor network hiccup can translate to significant business losses in revenue and reputation. Here’s why network monitoring is indispensable:
- Ensuring System Health, Reliability, and Uptime: Downtime isn’t just inconvenient—it’s costly. Network monitoring ensures that potential issues are identified and rectified before they can cause significant disruptions.
- Detecting and Mitigating Potential Security Threats: Monitoring becomes essential as cyber threats grow in number and sophistication. Network traffic analysis tools provide insights into suspicious activities, allowing for timely interventions. DDoS detection and mitigation, a use-case that Kentik specializes in, ensures that potential denial-of-service attacks are swiftly identified and dealt with, safeguarding the network’s integrity.
- Enhancing Overall System Performance: Networks aren’t static; they evolve. By understanding how network resources are utilized, administrators can optimize configurations, ensuring that current and future demands are met efficiently. Techniques like synthetic monitoring and real user monitoring provide insights into user experience, ensuring that the network not only functions optimally but also meets user expectations.
Key Components of Network Monitoring
Network Devices and Nodes
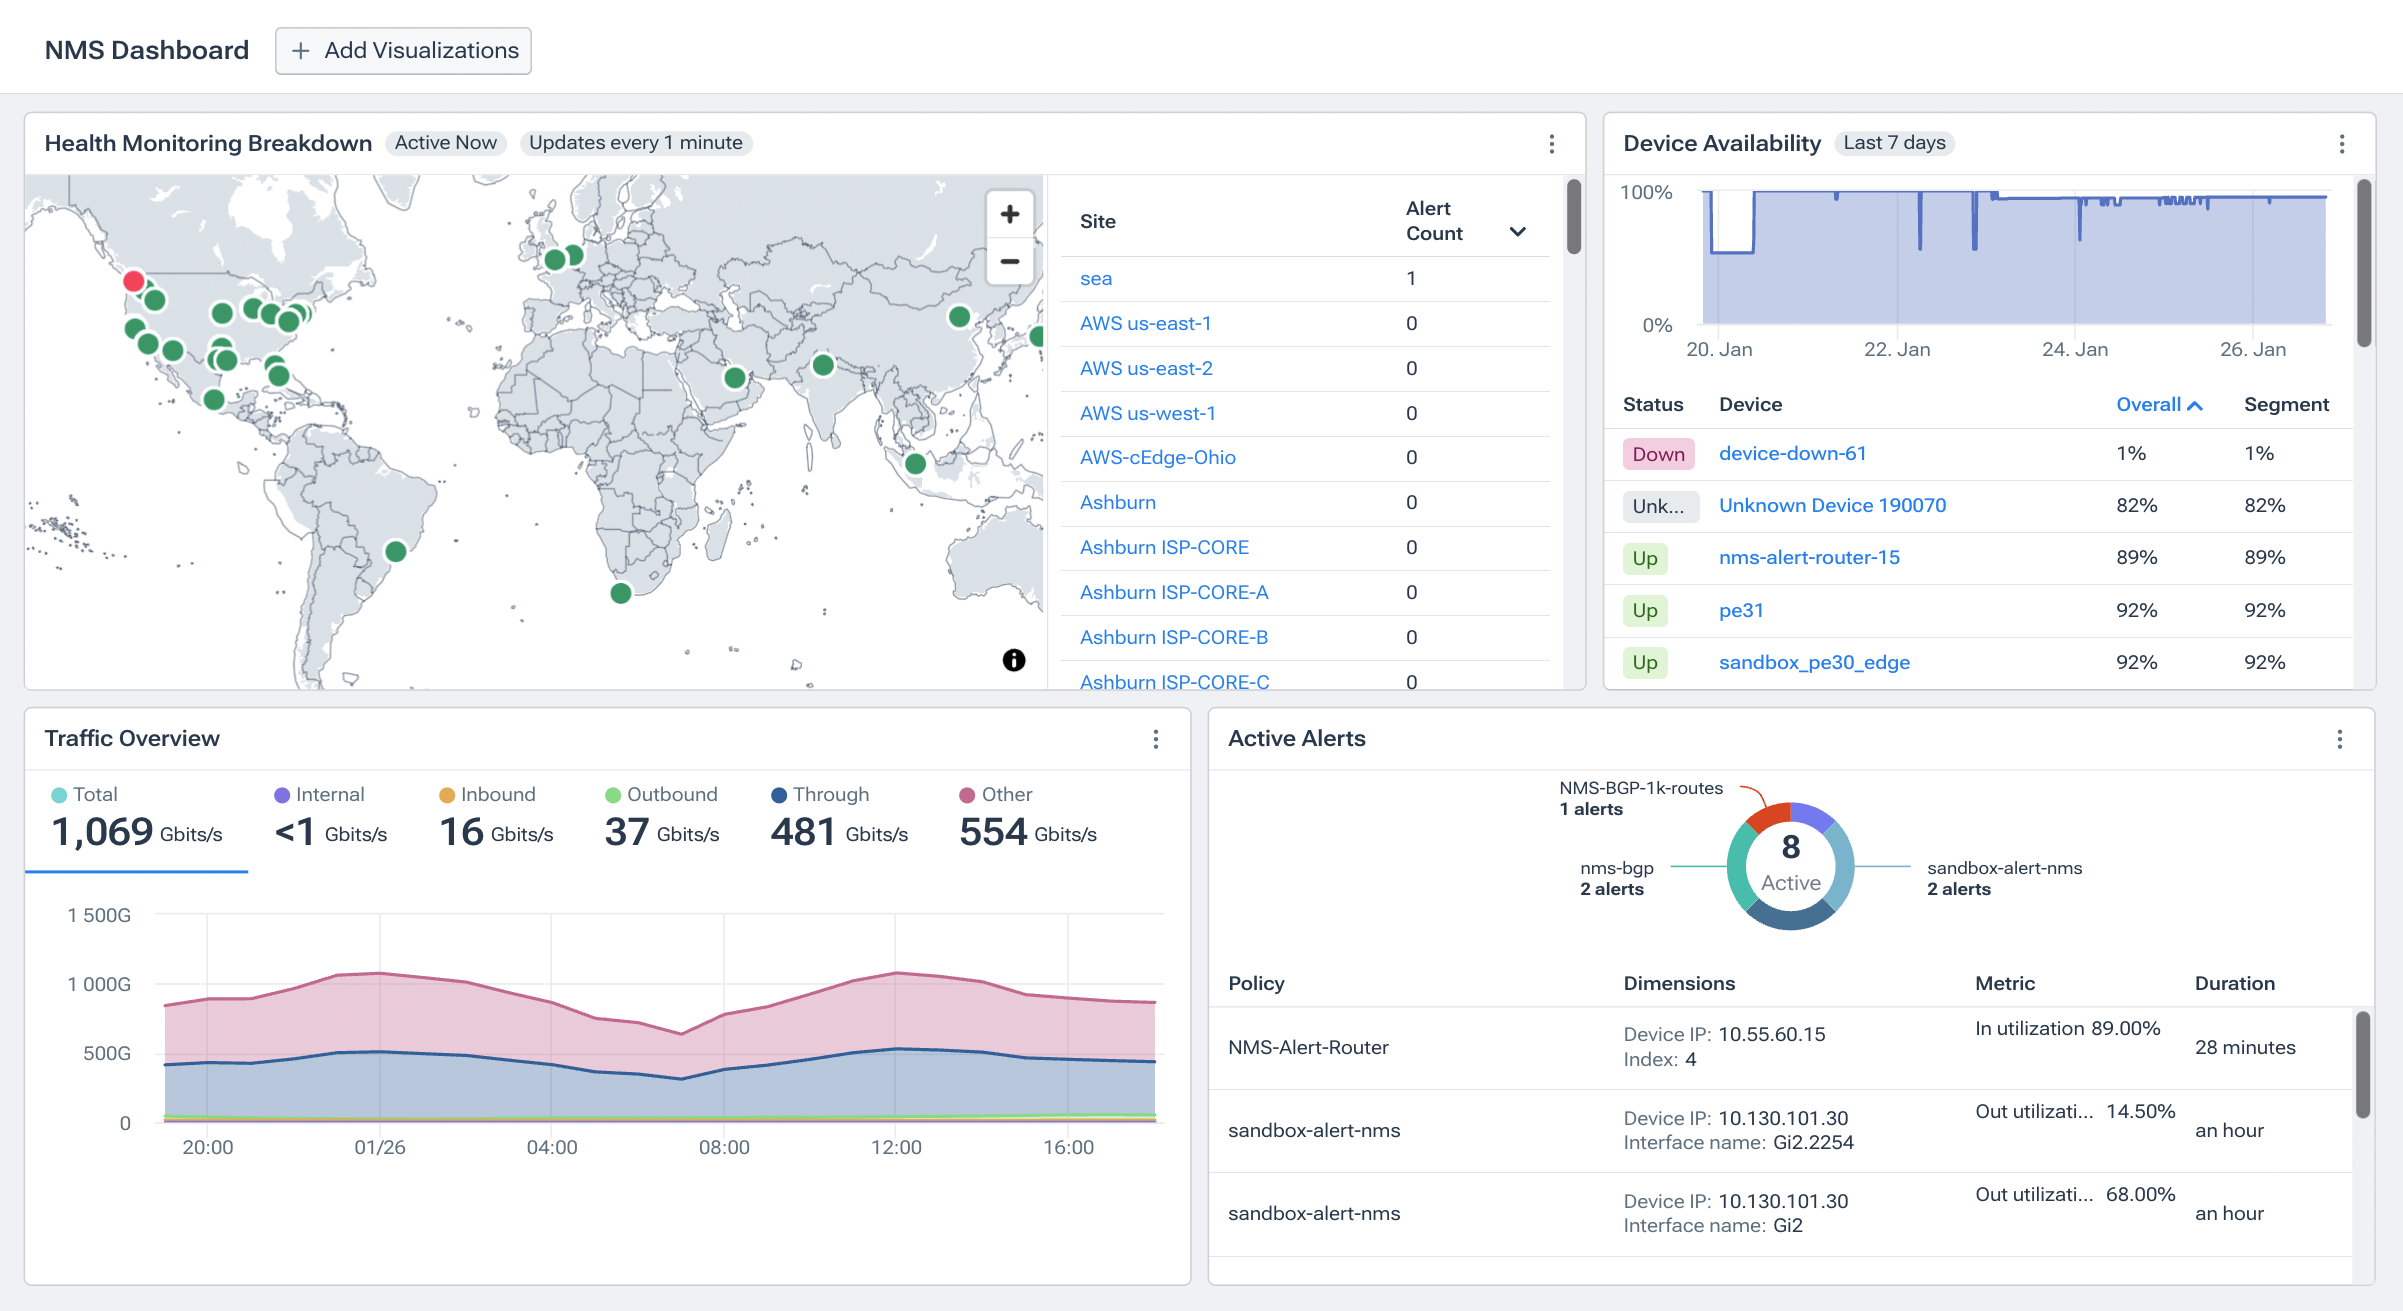
Every network comprises myriad devices, including routers, switches, servers, and more. Network device monitoring ensures that each of these components operates optimally. Network administrators can preemptively address issues by keeping tabs on device health, performance, and availability, reducing the risk of network downtime or service degradation.
Network Traffic Analysis
A network’s traffic patterns can offer invaluable insights. Network administrators can pinpoint bottlenecks, optimize data flow, and ensure that resources are allocated efficiently by understanding network topology, mapping, and visualization. Real-time network traffic analysis also aids in detecting unusual patterns, which could indicate security threats or system malfunctions.
Monitoring Network Health Metrics
Monitoring key device health indicators such as latency, bandwidth, uptime, and error rates provide a comprehensive view of the network’s health. Network teams can continuously track these metrics to ensure performance standards are met and maintained.
Network Monitoring Alerts, Reports and Notifications
Timely intervention can be the difference between a minor hiccup and a major outage. By setting up thresholds for real-time alerts and integrating with tools like API monitoring and network automation, administrators are instantly notified of potential issues, allowing for swift troubleshooting and remediation. For a more in-depth look at network alerting strategies, see “Network Monitoring Alerts: Best Practices for Network Alert Management”.
The definitive guide to running a healthy, secure, high-performance network

Types of Network Monitoring Techniques
There’s no one-size-fits-all approach to network monitoring. Though we can think of network monitoring technologies as belonging to one of the three broad pillars discuessed previously, there are a wide variety of application-specific techniques known by different terms. Some of the most common types of network monitoring include:
-
Synthetic Monitoring: This method (also known as synthetic transaction monitoring) involves simulating user interactions with applications or services to measure performance. It’s beneficial for preemptively identifying issues before they affect end-users.
-
Real User Monitoring (RUM): While synthetic monitoring simulates user interactions, RUM captures and analyzes the actual experiences of real users. It provides insights into how real users interact with applications, helping businesses optimize for better user satisfaction and improved user experience.
-
Digital Experience Monitoring: An evolution of both RUM and Synthetic Monitoring, this technique provides a holistic view of user experience, combining metrics and insights from both real users and synthetic tests to ensure optimal digital interactions.
-
Bandwidth Utilization Monitoring: As the name suggests, this technique focuses on how bandwidth is consumed. Understanding the traffic patterns and usage spikes ensures that network resources are used efficiently without overloads.
-
NetFlow Analysis: Using the NetFlow protocol, this technique captures and analyzes network traffic flow data. It provides insights into traffic patterns, helping administrators understand where traffic is coming from, going to, and why. Beyond NetFlow, there are other flow protocols like sFlow and jFlow and cloud-based equivalents such as VPC flow logs. NetOps professionals can get insights into traffic patterns and trends by sampling and analyzing network traffic flows.
-
Network Device Monitoring: This technique focuses on the health and performance of individual network components, such as routers, switches, and servers. Monitoring each device’s functionality ensures optimal network performance and early detection of potential issues.
-
SNMP Monitoring: SNMP monitoring leverages the Simple Network Management Protocol to oversee and analyze the health and performance of network devices. It’s a standardized approach enabling network engineers and administrators to collect crucial data from various types of networking equipment such as routers, switches, and firewalls.
-
Cloud Network Performance Monitoring: As more businesses migrate to the cloud, monitoring the performance of cloud-based resources becomes essential. This technique ensures that cloud services, applications, and infrastructures perform optimally and securely.
-
SD-WAN Monitoring: Supervises Software-Defined Wide Area Network operations, optimizing cloud and on-premises connectivity, enhancing application performance, and ensuring network security.
-
Network Performance Monitoring (NPM) or NPMD: Network Performance Monitoring and Diagnostics focuses on a network’s overall health and speed. It assesses various metrics such as latency, bandwidth usage, and packet loss to ensure a seamless network experience. It’s essential for detecting, diagnosing, and resolving network performance issues.
-
DNS Monitoring: Monitoring Domain Name System (DNS) services ensures that domain name requests are being resolved quickly and correctly, which is crucial for the smooth functioning of internet-based services.
-
Quality of Service (QoS) Monitoring: For networks that prioritize certain types of traffic (like VoIP or video streaming), QoS monitoring ensures that these priorities are being met and that high-priority traffic gets the bandwidth and performance it needs.
-
BGP Monitoring: Monitors the operation of Border Gateway Protocol (BGP) to ensure optimal route selection and prevent BGP route leaks or hijacks.
-
API Monitoring: Focuses on the performance and availability of Application Programming Interfaces, ensuring that APIs respond quickly, correctly, and securely.
Modern Challenges in Network Monitoring
Today’s network environments are more dynamic and complex than ever, introducing a new set of challenges:
- Scale and Bandwidth: With the proliferation of IoT devices and high-data applications, networks face unprecedented demands. Effective bandwidth utilization monitoring is essential to handle this surge without compromising performance.
- Security: In an era of increasing cyber threats, monitoring for anomalies, DDoS attacks, and potential breaches is crucial. Detecting and mitigating network threats requires sophisticated threat detection mechanisms that go beyond simple traffic analysis.
- Complexity: Multicloud deployments, hybrid environments, and distributed architectures introduce layers of complexity. Navigating this requires advanced tools and strategies, with network capacity planning playing a pivotal role. Integrating protocols like SNMP, streaming telemetry, and technologies like NetFlow adds to this complexity, demanding a holistic approach to network monitoring.
Tools and Technologies in Network Monitoring
A plethora of tools exist in the market, each offering unique functionalities. Whether it’s synthetic transaction monitoring that simulates user interactions or comprehensive platforms that provide end-to-end visibility, the right tool can make all the difference. When selecting tools, scalability, real-time insights, and integration capabilities should be top considerations. Kentik, for example, offers a suite of solutions tailored for modern network monitoring needs, ensuring that businesses stay agile, informed, and ahead of potential issues.
Network Monitoring Best Practices
To maximize the benefits of network monitoring and ensure a robust and resilient network, consider the following best practices:
Conduct Regular Audits
Network environments are dynamic and evolve over time. Conducting periodic audits helps ensure that the monitoring configurations and thresholds remain relevant and effective. It’s essential to monitor new devices, applications, or services that might have been added to the network and ensure they’re properly monitored on an ongoing basis.
Adopt a Proactive Approach to Monitoring
Instead of merely reacting to problems, a proactive approach aims to predict and prevent them. This entails setting up alerts for potential issues before they escalate, analyzing trends, and making data-driven adjustments to avoid future problems. For example, if a server consistently hits 80% capacity during peak hours, it might be time to consider an upgrade or optimization before it becomes a bottleneck.
Engage in Continuous Learning
The field of network management and monitoring is constantly evolving. New threats emerge, technologies advance, and best practices adapt. Staying updated with the latest developments, attending workshops, and participating in relevant communities can provide invaluable insights and keep your network monitoring strategy sharp and effective.
The Future of Network Monitoring
As technology advances, so does the landscape of network monitoring:
Evolution to Network Observability
While monitoring provides insights into the health and performance of a network, observability dives deeper. It’s about understanding the “why” behind performance metrics, allowing for a more in-depth analysis and a holistic view of the network. Network observability uses diverse data sources to understand what is happening inside a network, and how the internal state of the network impacts business objectives and user experience.
AI and ML in Automated Network Monitoring
Artificial Intelligence (AI) and Machine Learning (ML) are set to revolutionize network monitoring. These technologies can analyze vast amounts of data in real time, detect patterns, predict potential issues, and even automate remediation processes. Imagine a network that can self-heal and optimize with minimal human intervention.
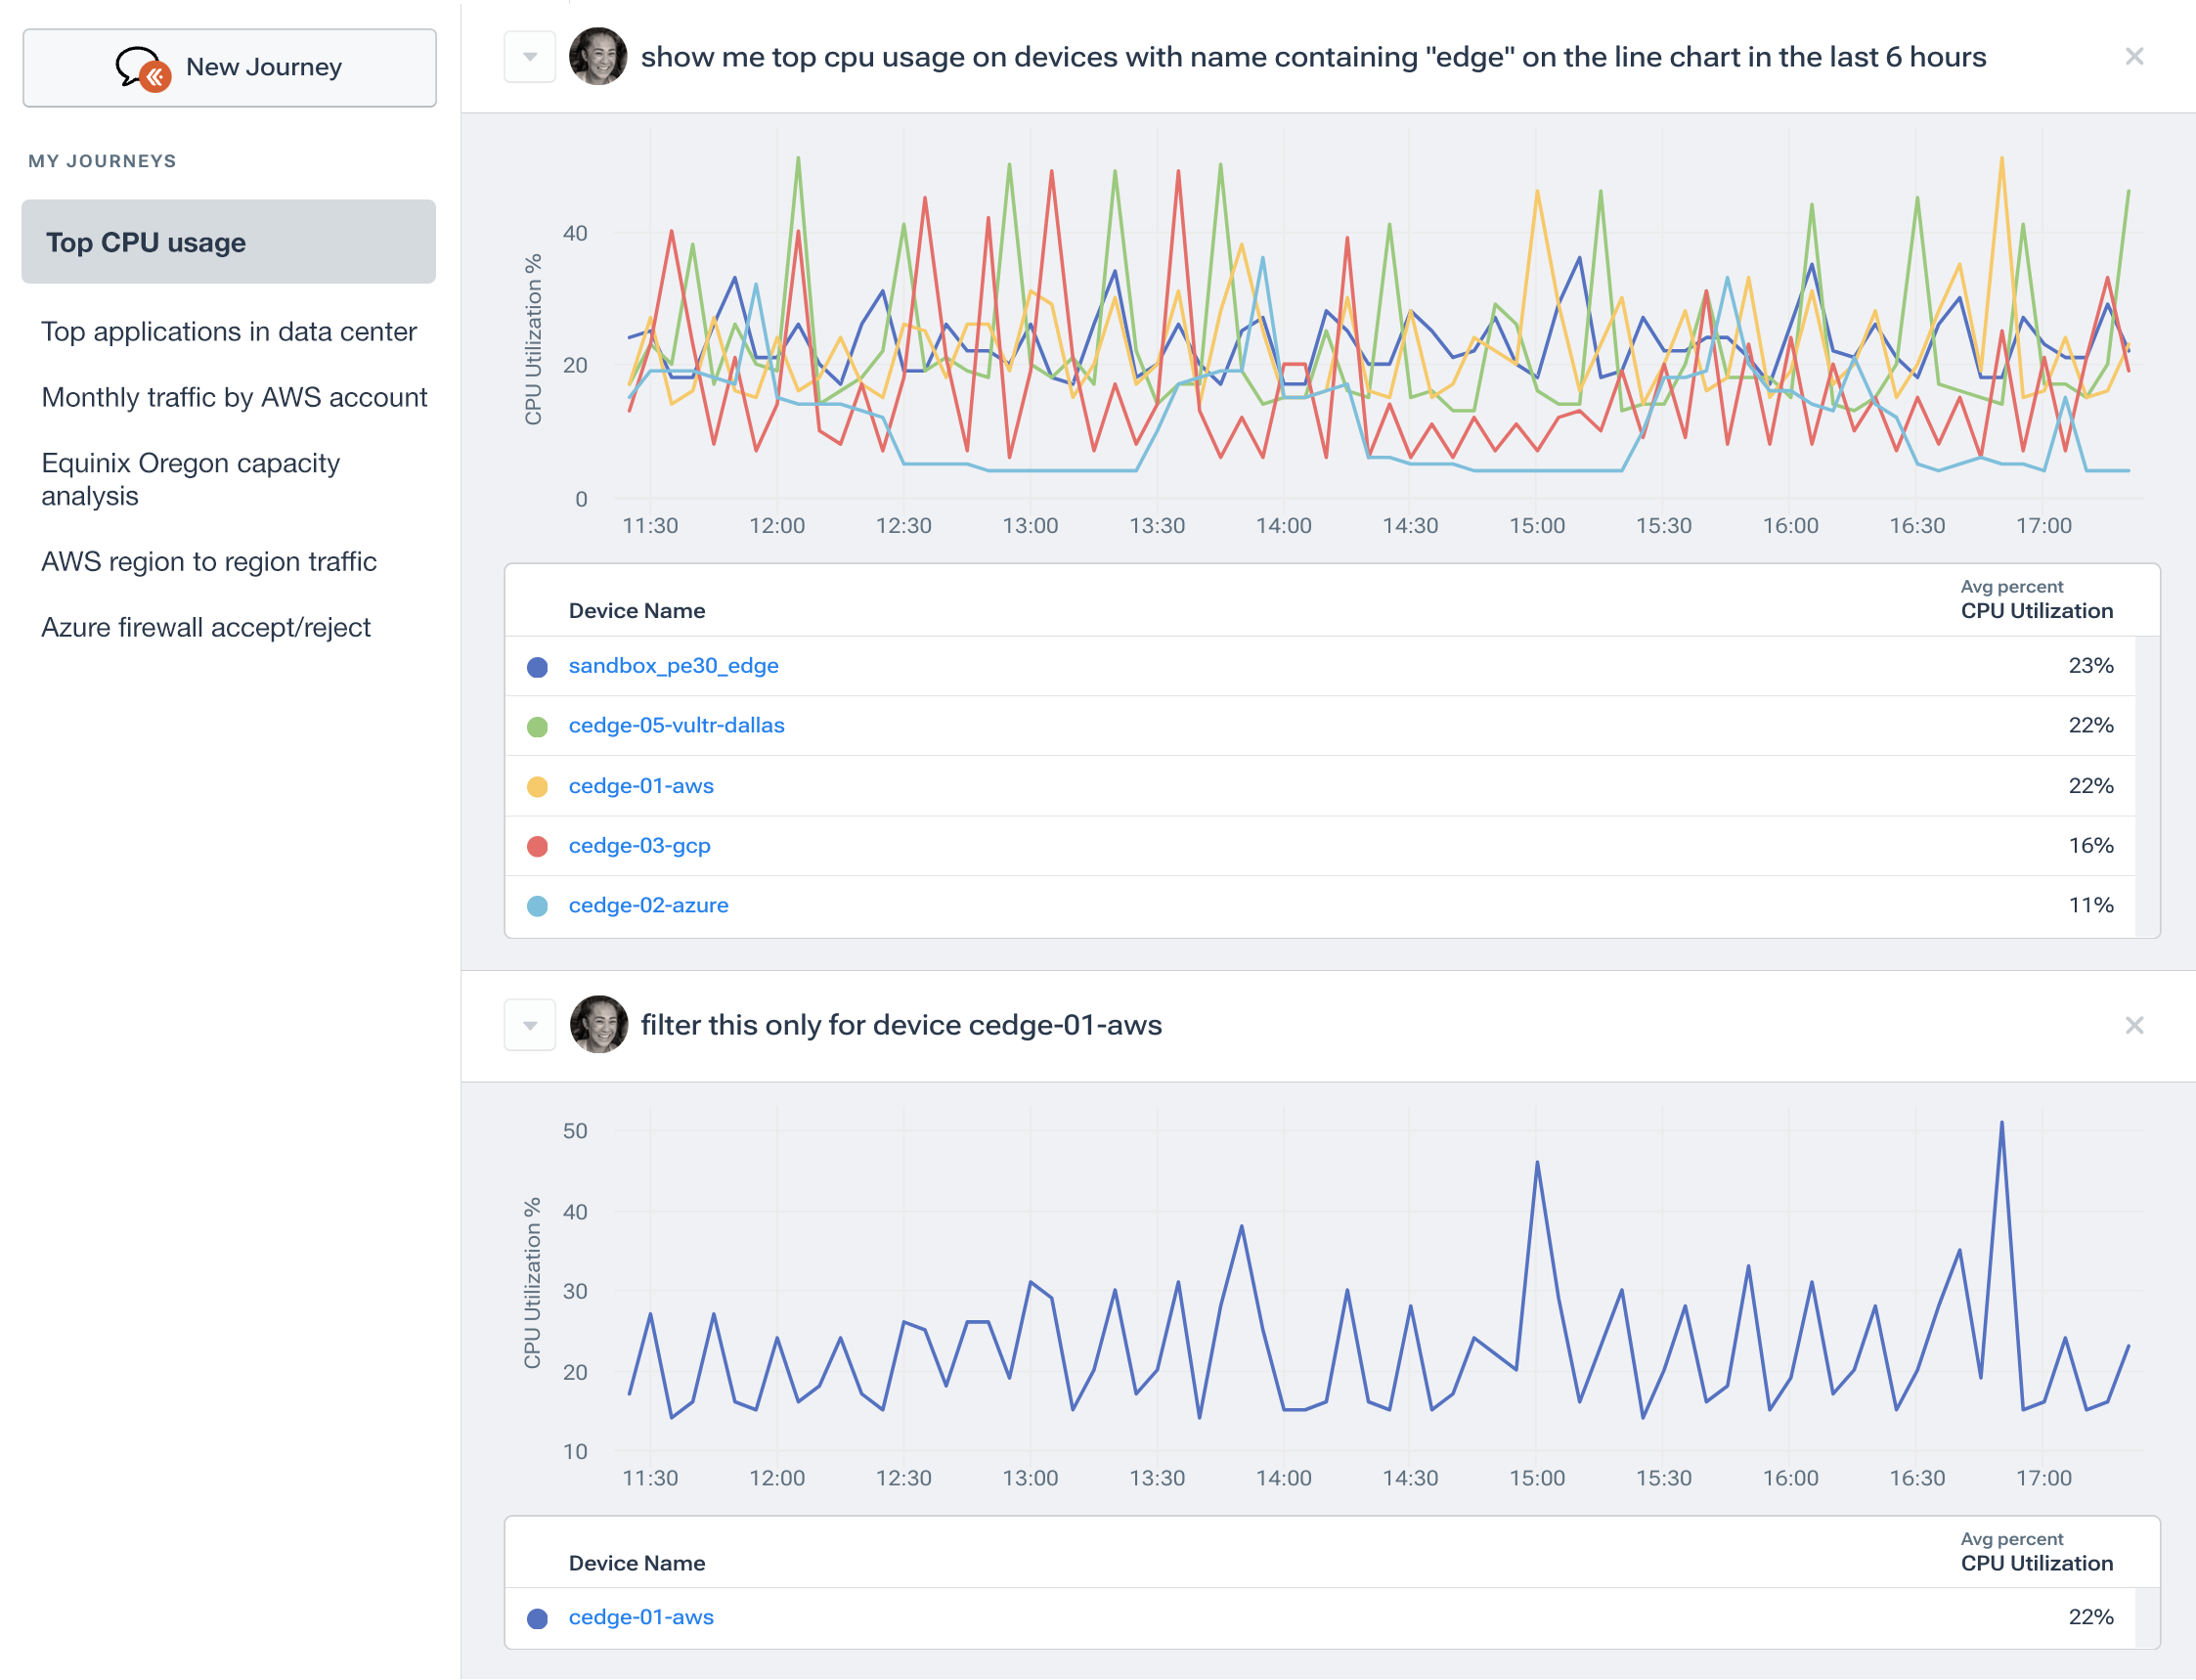
Recent advances in generative AI have already been incorporated into modern network monitoring systems such as Kentik NMS. Kentik AI allows NetOps professionals and non-experts alike to ask questions—and immediately get answers—about the current status or historical performance of their networks using natural language queries. This tool allow administrators to understand on-premises, hybrid, and multicloud networking environments from a single query engine. Because it combines network data from all sorts of protocols—including flow data, SNMP, streaming telemetry, containers, and cloud flow logs—Kentik AI enables unprecedented visibility into modern networks.
User Experience Monitoring
As businesses become increasingly digital, ensuring an optimal user experience becomes crucial. Traditional network health metrics will remain essential, but understanding how users interact with services and applications will gain prominence. Techniques like Synthetic Monitoring and Real User Monitoring will play pivotal roles in this transition.
Network Monitoring with Kentik
In an era where businesses are so intricately tied to their digital infrastructures, the importance of network monitoring can’t be overstated. It’s not just about preventing downtimes or optimizing bandwidth—it’s about ensuring businesses can operate seamlessly, innovate, and deliver value to their customers.
Kentik offers a suite of advanced network monitoring solutions designed for today’s complex, multicloud network environments. The Kentik Network Observability Platform empowers network pros to monitor, run and troubleshoot all of their networks, from on-premises to the cloud. Kentik’s network monitoring solution addresses all three pillars of modern network monitoring, delivering visibility into network flow, powerful synthetic testing capabilities, and Kentik NMS, the next-generation network monitoring system.
To see how Kentik can bring the benefits of network observability to your organization, request a demo or sign up for a free trial today.
