Top Talkers
Networking plays a pivotal role in the overall success of an organization. With numerous applications, devices, and users vying for network resources, understanding and managing network traffic has become increasingly important. One concept that network administrators often encounter when dealing with network traffic is that of “top talkers.” This article explains the idea of top talkers in networking, exploring its significance, ways to identify and manage these top talkers, and how Kentik’s robust Network Intelligence Platform can provide valuable insights into this aspect of network management.
What are Top Talkers in Networking?
Top talkers is a term commonly used in network management and monitoring to refer to the hosts or endpoints consuming the most bandwidth in a network. These are typically the sources or destinations of the highest volume of network traffic, which could include data, voice, or video traffic.
Identifying top talkers can be crucial to network performance monitoring, network troubleshooting, and capacity planning. It can help network administrators to understand how network resources are being used, identify potential bottlenecks, and allocate bandwidth more effectively. For instance, a single top talker could be consuming many network resources, causing slow performance for other users. Alternatively, an unexpected top talker could indicate a network security issue, such as a compromised device sending out large amounts of malicious traffic.

Monitoring tools like Kentik’s network traffic analysis platform offer real-time monitoring, alerting, and historical analysis to quickly and effectively respond to top talkers. But it’s not just about limiting bandwidth usage; it’s essential to understand why specific hosts generate substantial traffic. This could involve optimizing applications, modifying user behavior, or upgrading network infrastructure.
Explore Top Talkers Reports in Kentik
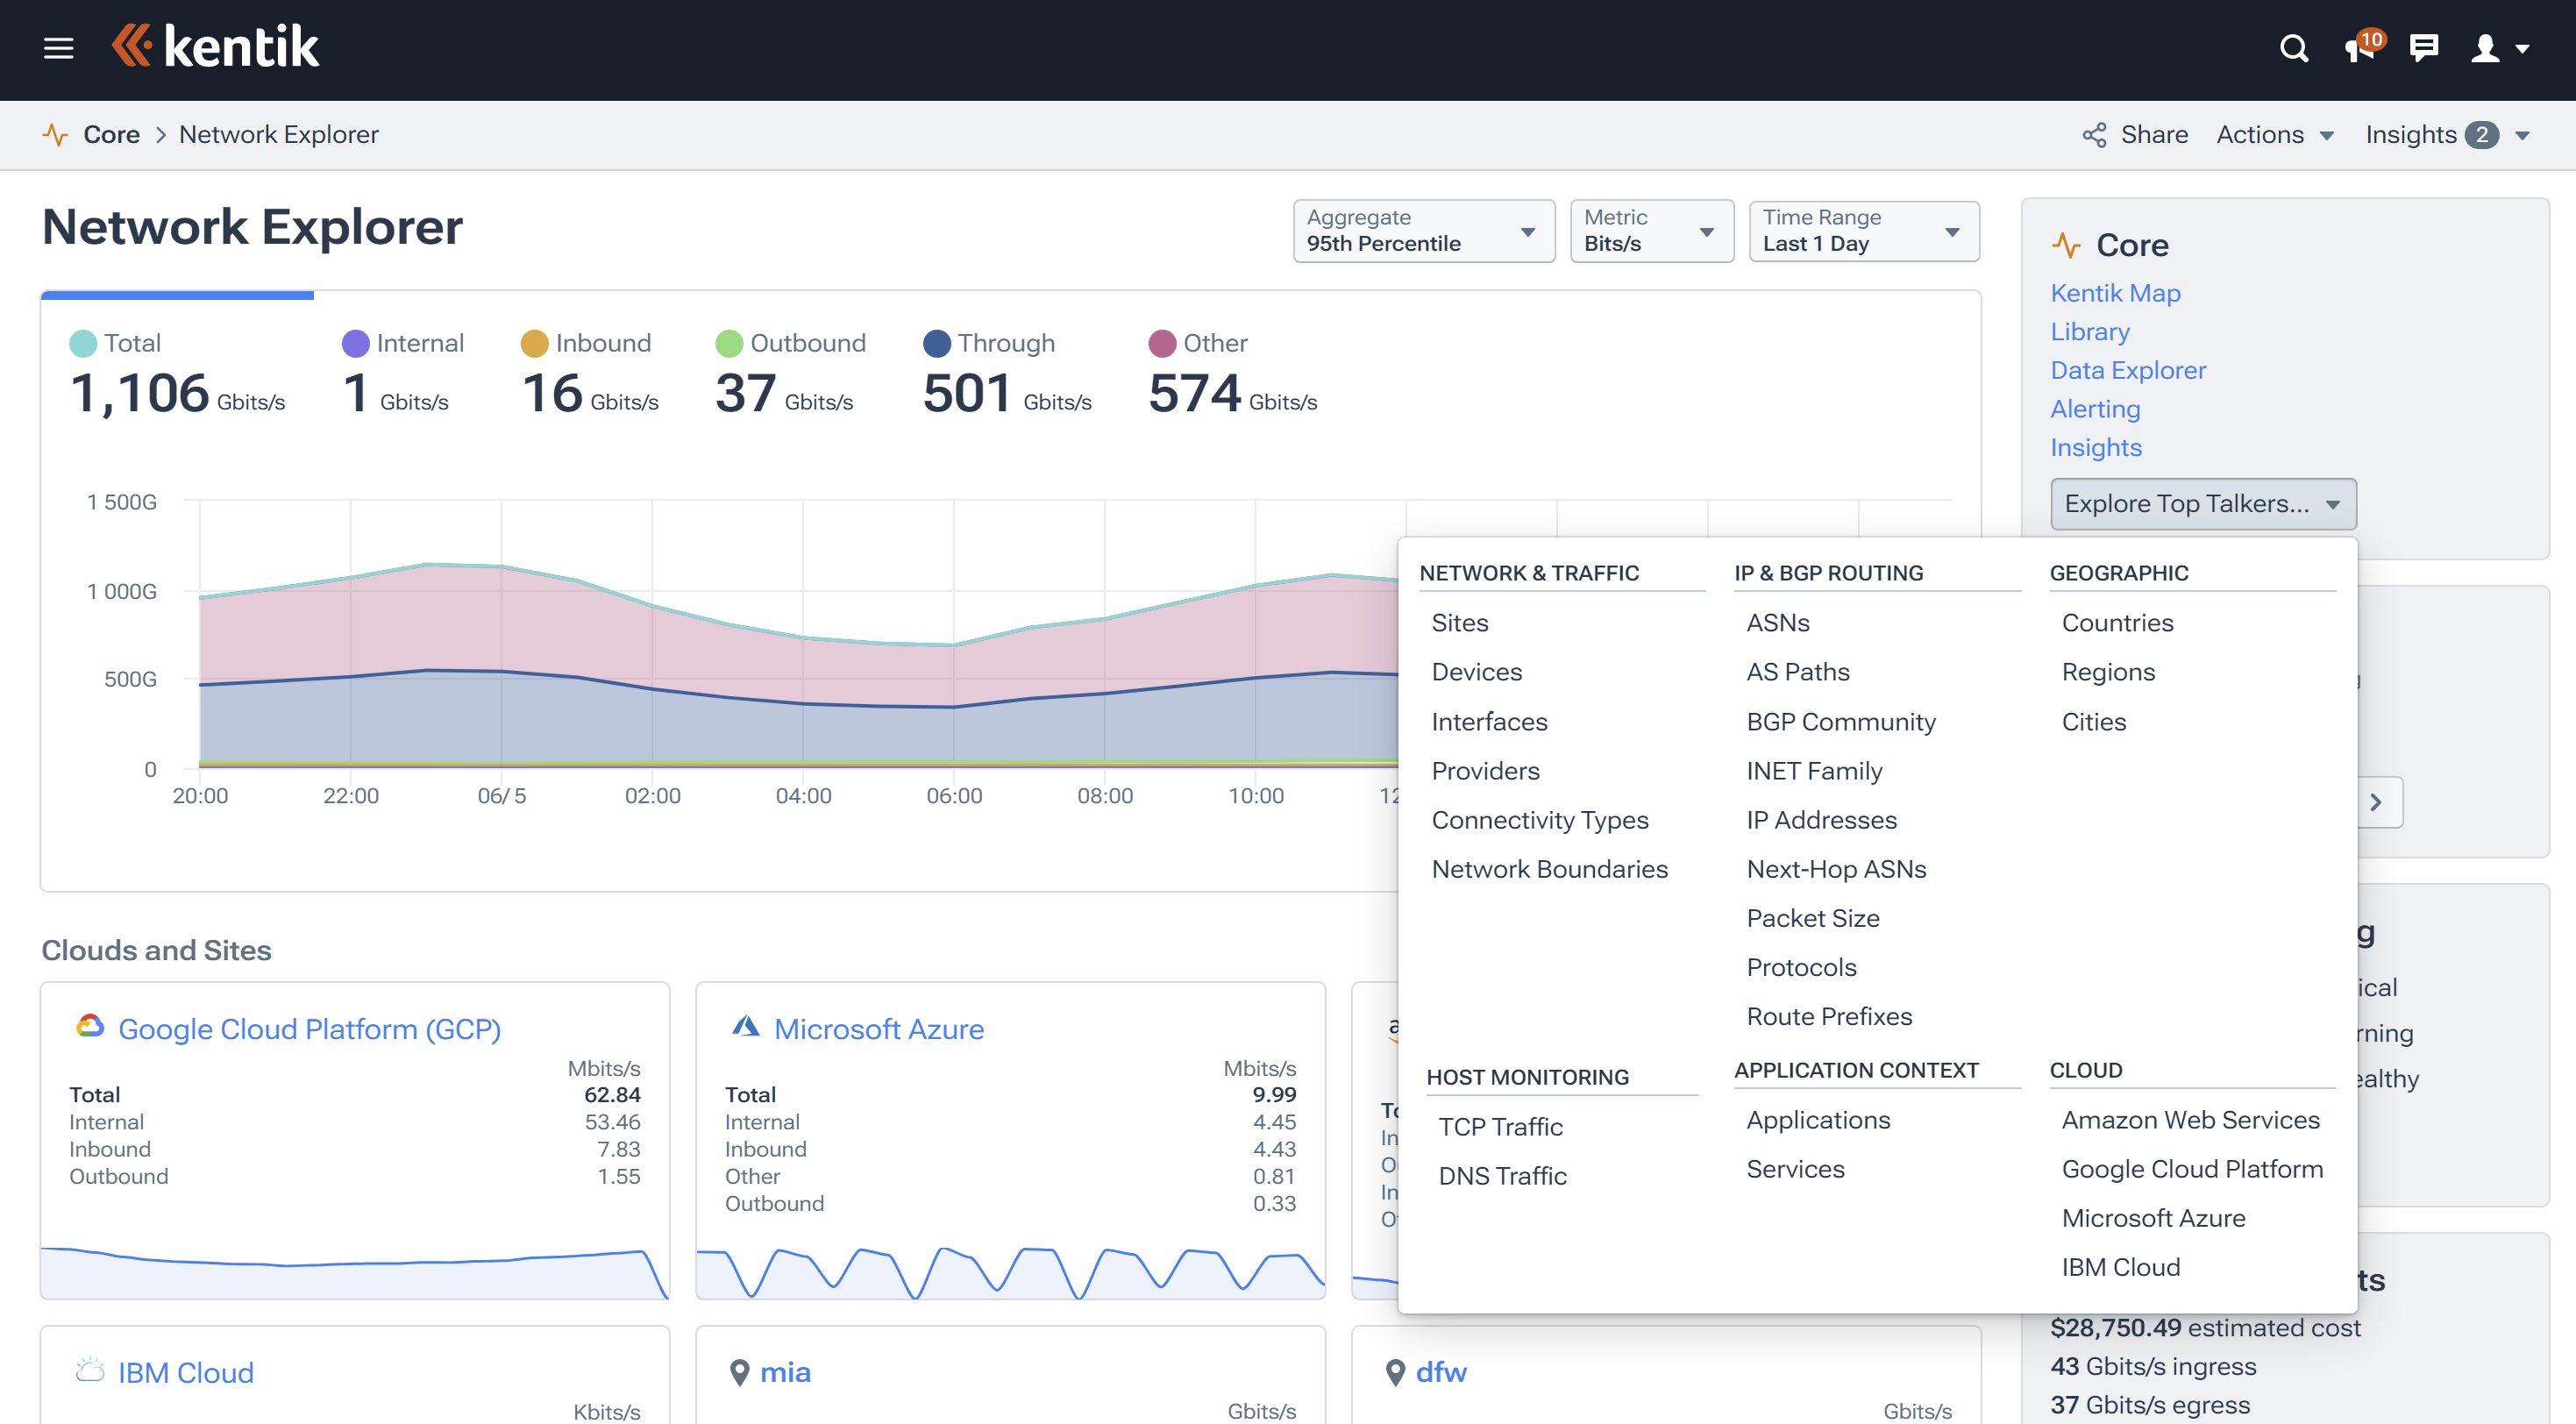
Kentik includes pre-built “Explore Top Talkers” reports that allow quick and easy visualization and analysis of top talkers across all classes of network traffic. This robust feature set provides granular insights and helps network admins and NetOps professionals manage network resources more effectively.

Categories of top talker reports in Kentik include:
-
Network and Traffic: Allows administrators to identify top talkers by sites, devices, interfaces, providers, connectivity types, and network boundaries. This helps identify which network devices or sites are using the most resources.
-
IP & BGP routing: Administrators can visualize top talkers by a wide range of metrics such as ASNs, AS paths, BGP communities, INET Family, IP addresses, next-hop ASNs, packet size, protocols, and route prefixes. This is particularly useful for managing routing and for traffic engineering purposes.
-
Geography: This feature lets users view top talkers by region, country, or city. This can be useful for understanding geographic patterns in network usage and can assist in planning network expansions or managing geographically-distributed networks.
-
Host Monitoring: Users can view top talkers by TCP or DNS traffic. This can be particularly useful for understanding application behavior and managing application performance.
-
Application Context: This feature allows administrators to see top talkers by application or service, which can help them optimize application performance and manage application-specific traffic.
-
Cloud Providers: Kentik allows visualization of top talkers across various cloud platforms like AWS (Amazon Web Services), Google Cloud Platform, Microsoft Azure, or Oracle Cloud Infrastructure. This can help administrators manage cloud-based services and workloads.
-
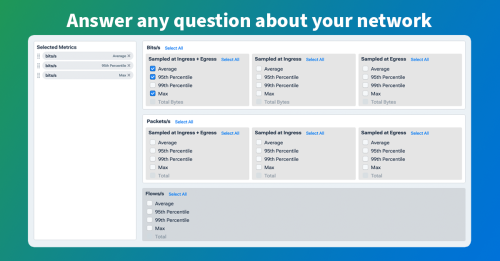
Flexible Filters and Metrics: Data to be visualized can be refined using a wide variety of filters, with traffic measured in bits per second, packets per second, or flows per second. This gives administrators flexibility and precision in analyzing network traffic.

All these features contribute to a detailed understanding of network traffic patterns, facilitating effective network management, optimization, and planning.
Kentik’s Network Explorer Views
Understanding the complex dynamics of your network traffic is critical to ensure optimum performance. Kentik’s Network Explorer is a powerful tool that allows you to dive deeply into your network traffic. With Network Explorer, you get a comprehensive and granular view of your network traffic, offering a greater understanding of your data’s flow, sources, and destinations.
Views in Network Explorer allow for easy visualization and analysis of network performance data, including:
-
Explorer Views: Explorer Views are divided into Aggregate Views and Detail Views. While Aggregate Views provide an overarching view of a particular type of network traffic, organized by categories based on various parameters, Detail Views focus on a single instance of a traffic class. Both views are readily accessible through the Network Explorer module.
-
Core Aggregate Pages: These pages zero in on a specific attribute of network traffic, such as a particular dimension or data source. You can see related insights, adjustable query parameter controls, tabbed graphs, and Aggregate Traffic Tables from here.
-
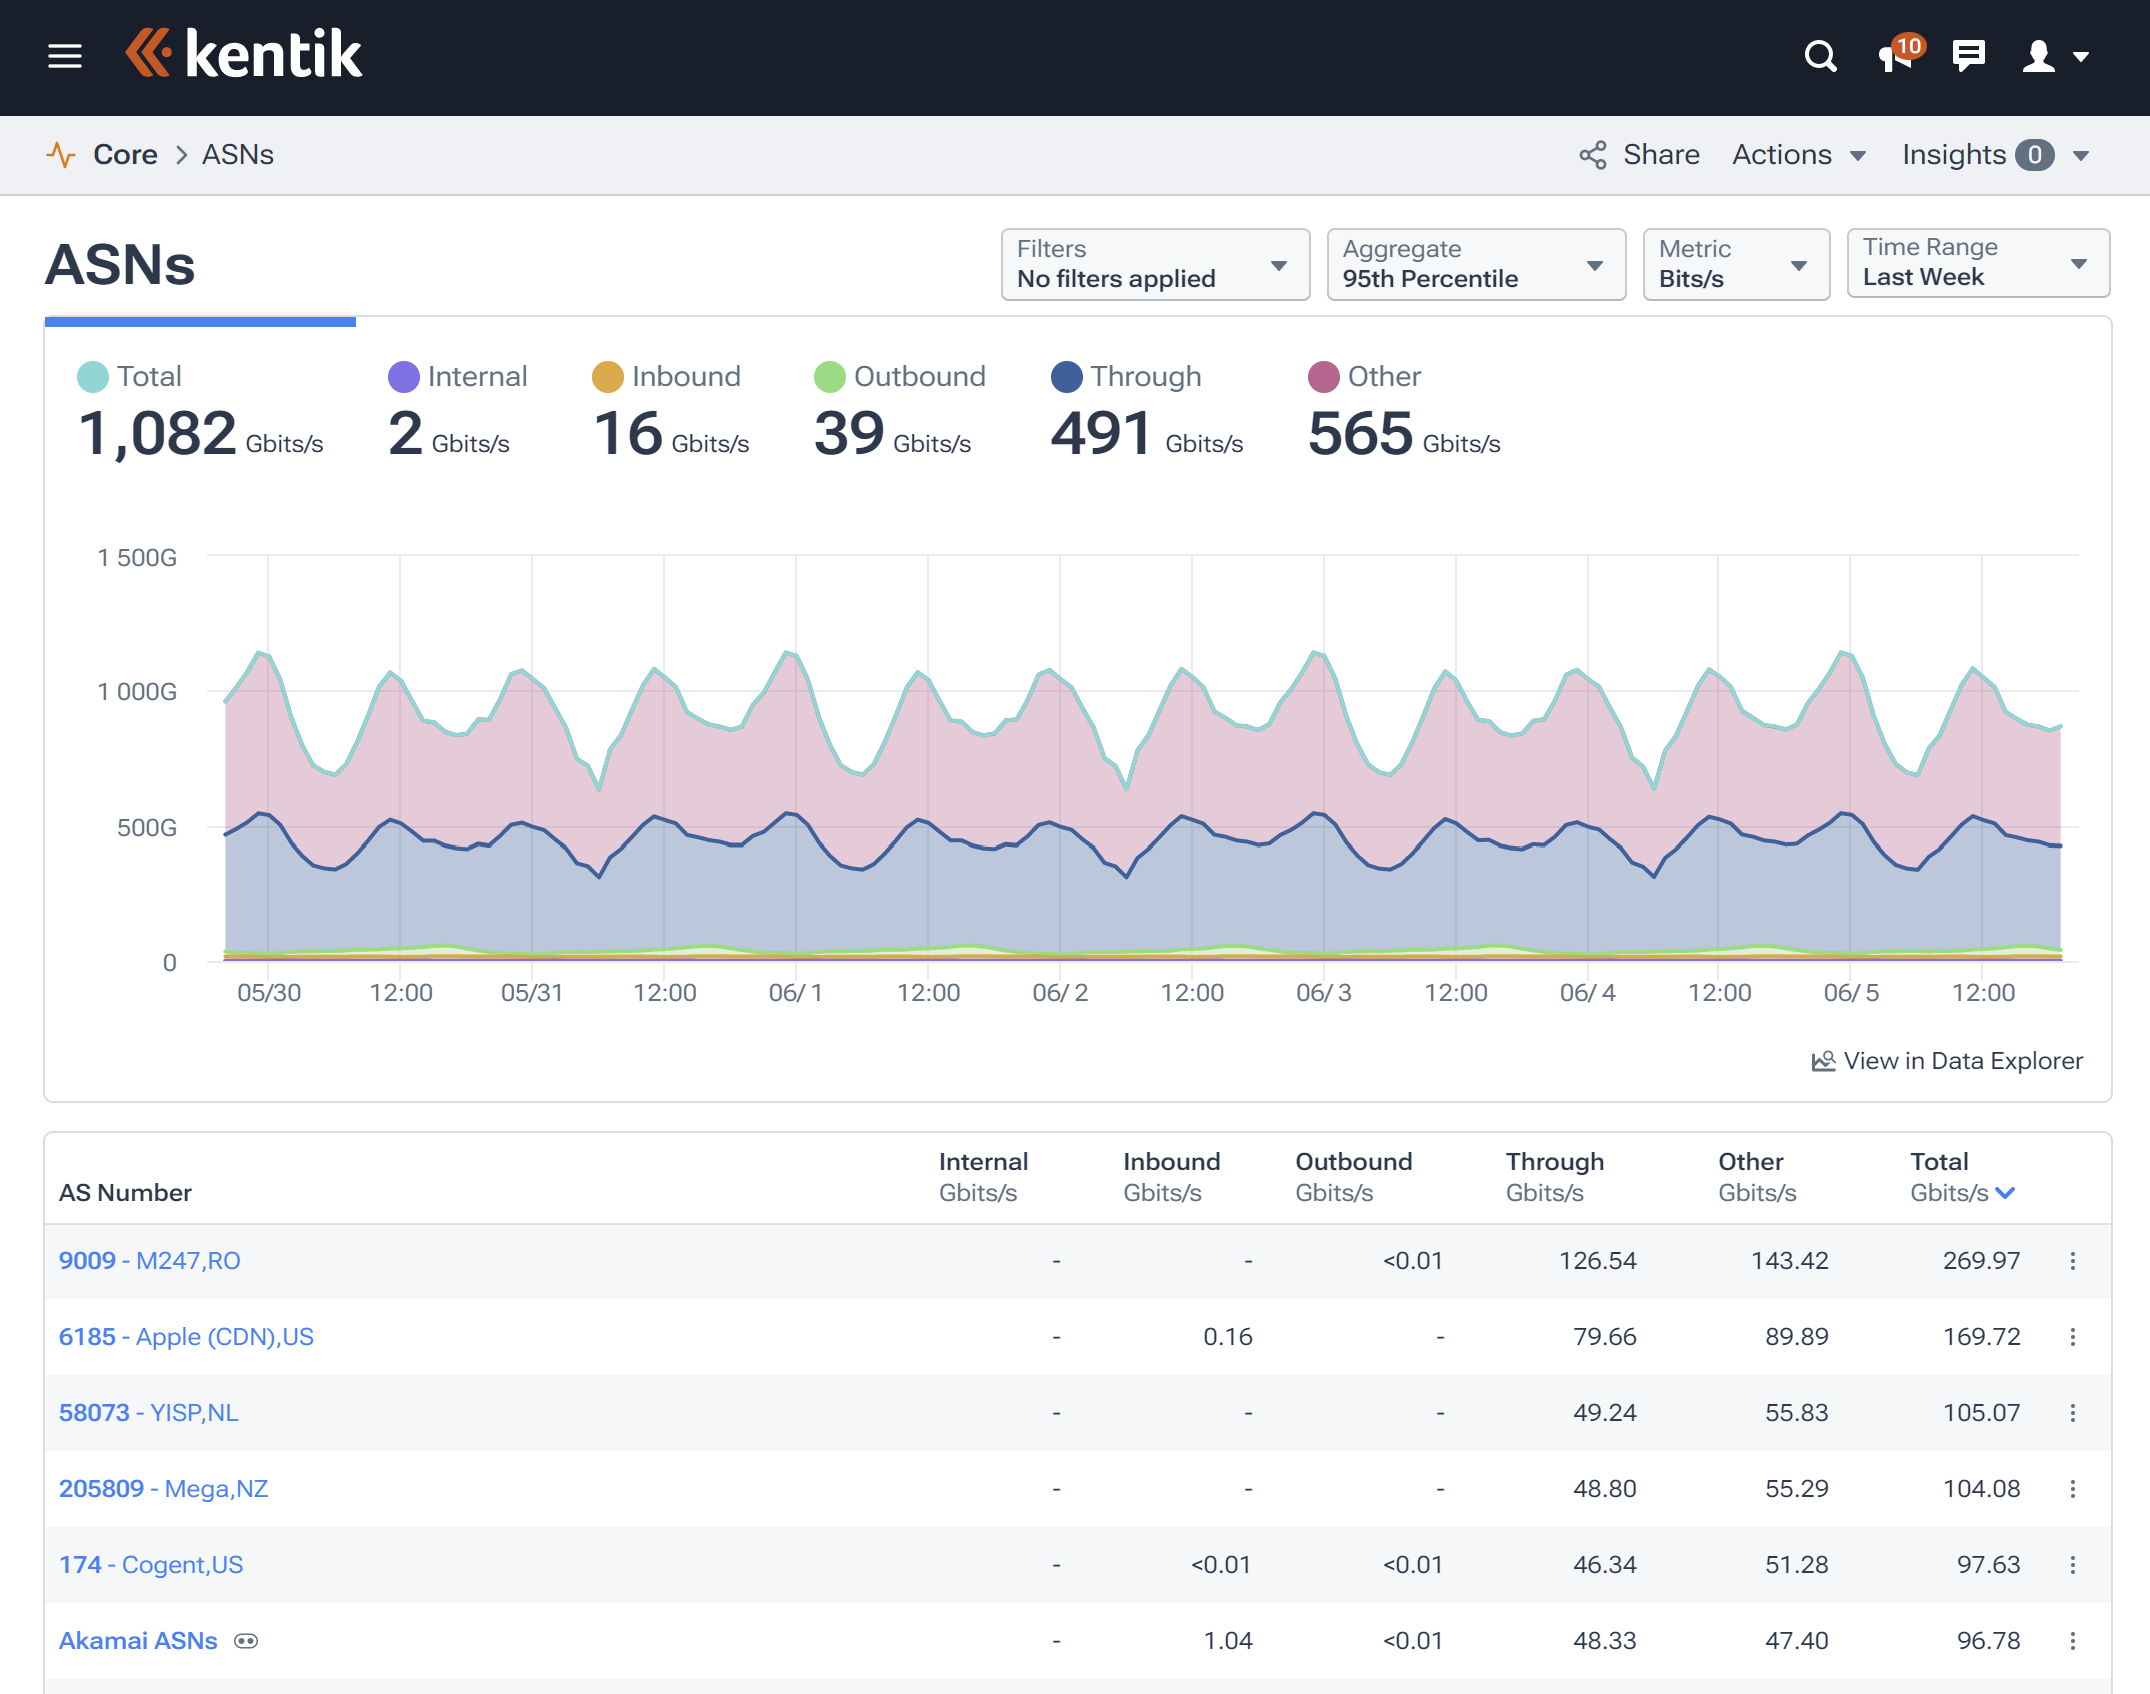
Aggregate Views Graph: This graph showcases the results from the query defined via the Parameter Controls. Tabs for Total, Internal, Inbound, or Outbound traffic might be visible depending on the traffic volume.
-
Aggregate Traffic Tables: These tables showcase the top instances of the dimension relevant to the current page, supplying comprehensive information and actionable insights for each instance. Kentik shows the Dimension name, a Breakdown popup, and data on Internal, Inbound, Outbound, and Total traffic volumes. A “View in Explorer” option is also available for a deep dive into the specifics of any report. See our blog post, “Exploring Your Network Data With Kentik Data Explorer” for more details.
-
Aggregate Views Categories: The Network Explorer views are classified into several categories for easy navigation. These include Network & Traffic, IP & BGP Routing, Geographic, Host Monitoring, Application Context, and Cloud.

Kentik’s Network Explorer equips you with the tools to conduct a thorough and nuanced analysis of your network, effectively identify and manage top talkers, and maintain an efficient network. Whether you need a bird’s eye view or a microscopic examination, Kentik caters to your needs, offering a flexible and powerful system for network management.
The definitive guide to running a healthy, secure, high-performance network

NetFlow and Top Talkers
NetFlow is a network protocol developed by Cisco for collecting IP traffic information and monitoring network traffic. It provides visibility into traffic flow characteristics like source and destination IP addresses, source and destination ports, packet and byte counts, and more. This information can be beneficial for understanding a network’s behavior and usage patterns.
NetFlow data can be especially valuable when identifying top talkers in a network, for a variety of reasons:
- Traffic Accounting: NetFlow data can be used to identify the primary sources and destinations of network traffic (top talkers), providing insight into which entities are consuming the most network resources.
- Network Planning and Analysis: NetFlow data can help network managers plan for capacity upgrades, understand application performance across the network, and make informed decisions about bandwidth allocation.
- Security: Unusual traffic patterns can be an indicator of security incidents. NetFlow data can be used to detect anomalies, potential DDoS attacks, network intrusions, and other security threats. A sudden change in a top talker’s behavior can be a red flag for network security.
- Billing: For service providers, NetFlow can assist in creating a fair billing system based on actual network usage. Identifying the top talkers can help justify costs to customers or internal business units.
Kentik, for example, uses flow data — like NetFlow, sFlow, J-Flow, IPFIX, and cloud traffic data from VPC flow logs and cloud flow logs — to provide real-time visibility across the network. This includes monitoring top talkers, network performance, DDoS detection, and more. Flow data is a fundamental input to the kind of comprehensive network traffic analysis that Kentik provides.
Get Visibility into Top Talkers on Your Networks with the Kentik Network Intelligence Platform
Networks are the lifeblood of modern organizations, but without deep insights, you’re flying blind. Get unparalleled visibility into the top talkers on your networks with the Kentik Network Intelligence Platform. Understand the who, what, when, and where of your network traffic, from data centers to the cloud. With Kentik, you can collect and analyze extensive network telemetry data enriched with contextual information for comprehensive insights.
Kentik offers a suite of advanced network monitoring solutions designed for today’s complex, multicloud network environments. The Kentik Network Intelligence Platform empowers network pros to monitor, run and troubleshoot all of their networks, from on-premises to the cloud. Kentik’s network monitoring solution addresses all three pillars of modern network monitoring, delivering visibility into network flow, powerful synthetic testing capabilities, and Kentik NMS, the next-generation network monitoring system.
To see how Kentik can bring the benefits of network observability to your organization, request a demo or sign up for a free trial today.


