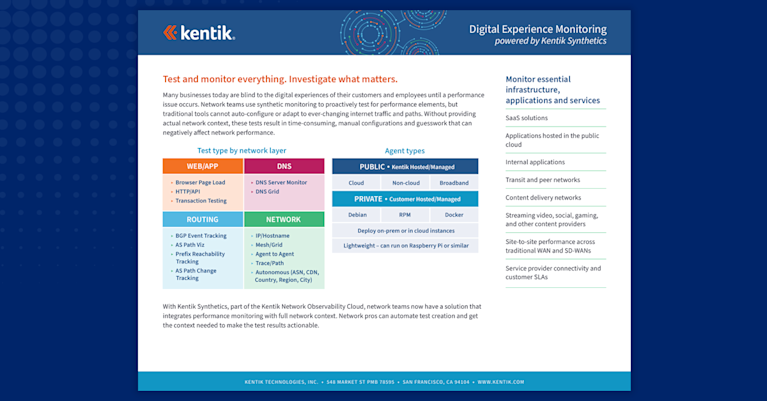
What is Synthetic Monitoring?
Synthetic monitoring, an integral part of application performance management, is designed to emulate user interactions with digital services. This proactive performance monitoring technique uses scripts to simulate user behavior across diverse scenarios, environments, and device types. Synthetic tests generate virtual user requests that replicate real-world interactions, which enables the analysis of key performance indicators such as application response time and resource availability.
The primary advantages of synthetic monitoring include:
- Application Performance Analysis: Synthetic monitoring provides crucial insights into an application’s performance, helping identify areas for improvement.
- Uptime and User Experience Tracking: This method continuously monitors application uptime, analyzing how applications respond to typical user behaviors.
- Focused Business Transaction Monitoring: Synthetic monitoring can help pinpoint issues within specific business transactions, such as challenges encountered during online purchases or form submissions.
Unlike passive monitoring methods like network flow or packet capture, synthetic monitoring proactively gauges the health and performance of network resources, applications, and services. As part of the evolving fields of Network Performance Monitoring and Digital Experience Monitoring, it is critical in enabling IT development, NetOps, and DevOps teams to improve user experiences and optimize business-critical functions.
How Does Synthetic Monitoring Fit into the Broader Context of Network Monitoring?
The complex field of network monitoring consists of three key areas that provide a comprehensive view of network performance, health, and user experience. Synthetic monitoring is one of these “pillars” of network monitoring:
-
Network Traffic Analysis (NTA): Often referred to as network flow analysis, network traffic analysis is the passive monitoring of actual traffic flowing across the network. NTA provides detailed insights into real-world network usage, which is invaluable for understanding overall network performance. NTA uses flow records (summaries of actual packet flows) using protocols such as NetFlow, VPC flow logs from cloud-based services, and packet traces (Deep Packet Inspection or DPI) to understand network performance metrics.
-
Synthetic Monitoring: Synthetic monitoring (or synthetic testing) is a part of Digital Experience Monitoring (DEM) and involves proactive testing of network functions to simulate actual user experiences. It’s a forward-looking approach that anticipates issues before they impact users.
-
Network Infrastructure Metrics: Infrastructure metrics collected by a Network Monitoring System (NMS) focus on the health and activity of network infrastructure devices like servers, network nodes, and storage nodes. This aspect of network monitoring is about maintaining and optimizing the physical and virtual components of the network. These metrics are gathered via methods like SNMP (Simple Network Management Protocol) and Streaming Telemetry (where devices are configured to send data automatically).
How Does Synthetic Monitoring Work?
Synthetic monitoring works by creating and executing scripted or pre-defined tests that simulate real user interactions with an application or service. This process involves:
- Developing test scripts: Design scripts that mimic common user behaviors and actions, such as clicking buttons, filling out forms, or navigating the application.
- Generating traffic types: Simulate various network conditions by generating diverse traffic types, including network, DNS, HTTP, and web traffic.
- Targeting specific resources: Direct the generated traffic to particular targets, such as IP addresses, servers, hosts, or web pages.
- Measuring performance metrics: Collect data on response times, availability, and other relevant metrics during the test.
- Establishing KPIs: Analyze the collected data to build key performance indicators (KPIs) for monitoring and optimizing the application or service’s performance.
Synthetic tests are automated and periodic, performed at regular intervals to ensure continuous monitoring of application or service performance. Advanced synthetic monitoring solutions, like Kentik Synthetics, can execute tests at sub-one-minute intervals for more accurate insights and real-time performance monitoring.
When researching synthetic monitoring, the related topic of passive “Real User Monitoring” (RUM) will likely turn up. Real User Monitoring involves capturing and analyzing each user transaction/interaction with an application. The idea is to track and monitor the actual usage of an application and record what happened (after the fact). In contrast to synthetic monitoring, RUM is a form of passive monitoring.
Active vs. Passive Monitoring: Synthetic and Real User Monitoring
It’s not a matter of which is better. It depends on what you’re trying to accomplish. Here are a couple of short definitions for both of these terms as they pertain to monitoring:
-
Active: A proactive test simulates a user by accessing a resource, waiting for a response, and interpreting any results from the communication. Synthetic monitoring is a form of active monitoring. A network management station that polls devices on a network is also an active monitor.
-
Passive: Passive monitoring reactively monitors actual/authentic user interactions with a resource and then measures and interprets the communications. Real user monitoring is a form of passive monitoring. Placing a packet analyzer on the network and observing traffic is also a form of passive monitoring.
Both active and passive monitoring are helpful and, while they are alternatives, combining both enables improvements and optimizations in the end-user digital experience.
(For a more detailed comparison of Synthetic Monitoring and Real User Monitoring, see “Synthetic Monitoring vs Real User Monitoring”.)
The Goal of Synthetic Monitoring
On the surface, the goal of active synthetic monitoring is to ensure that an application or service (e.g., web page, DNS) is up and responding to actual end users in a timely manner. It can answer questions such as:
- Is the DNS responding to end users in under 50 milliseconds?
- Is the website up and loading in under 1500 milliseconds?
- Are shopping cart transactions working?
- Are API endpoints available and responding in the expected manner?
To accomplish this, the synthetic transaction monitor generally measures two things:
- The availability of the resource over time (e.g., 99.999% up-time)
- The responsiveness in milliseconds of the resource over time
This reliable routine operation can provide more details than the above implies. Trending and alerting also play significant roles in this topic. These details are discussed in more detail below. (See also: “What is Synthetic Transaction Monitoring?” for more detail about monitoring specific web transactions that result from user actions in a site or web application.)
Types of Synthetic Monitoring: Use Cases
Synthetic monitoring solutions (such as Kentik Synthetics) offer a wide range of use cases that extend beyond traditional network performance monitoring, encompassing web application monitoring, user experience improvement, and more. These use cases are essential for customer segments, including service providers, corporate IT, and digital businesses, each with unique monitoring needs.
Web/Application Performance Monitoring
Synthetic monitoring enables web application developers and operations professionals to better understand web application availability, API performance, and user experience. The availability and proper operation of GET, HEAD, PATCH, POST, and PUT methods for various API endpoints can be ensured using HTTP-based synthetic tests. The availability of an endpoint and its HTTP response status codes (e.g., ensuring that authentication is working as expected) can be monitored. Other metrics such as average time to last byte, size of the response, etc. can also be measured.
These capabilities are crucial for maintaining optimal performance and identifying potential issues in real time.
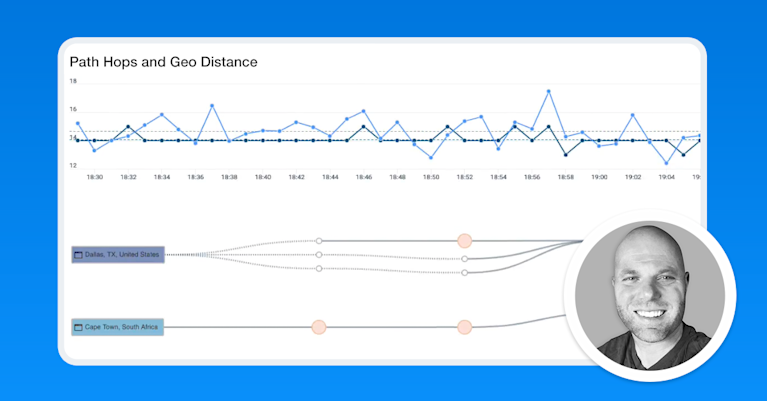
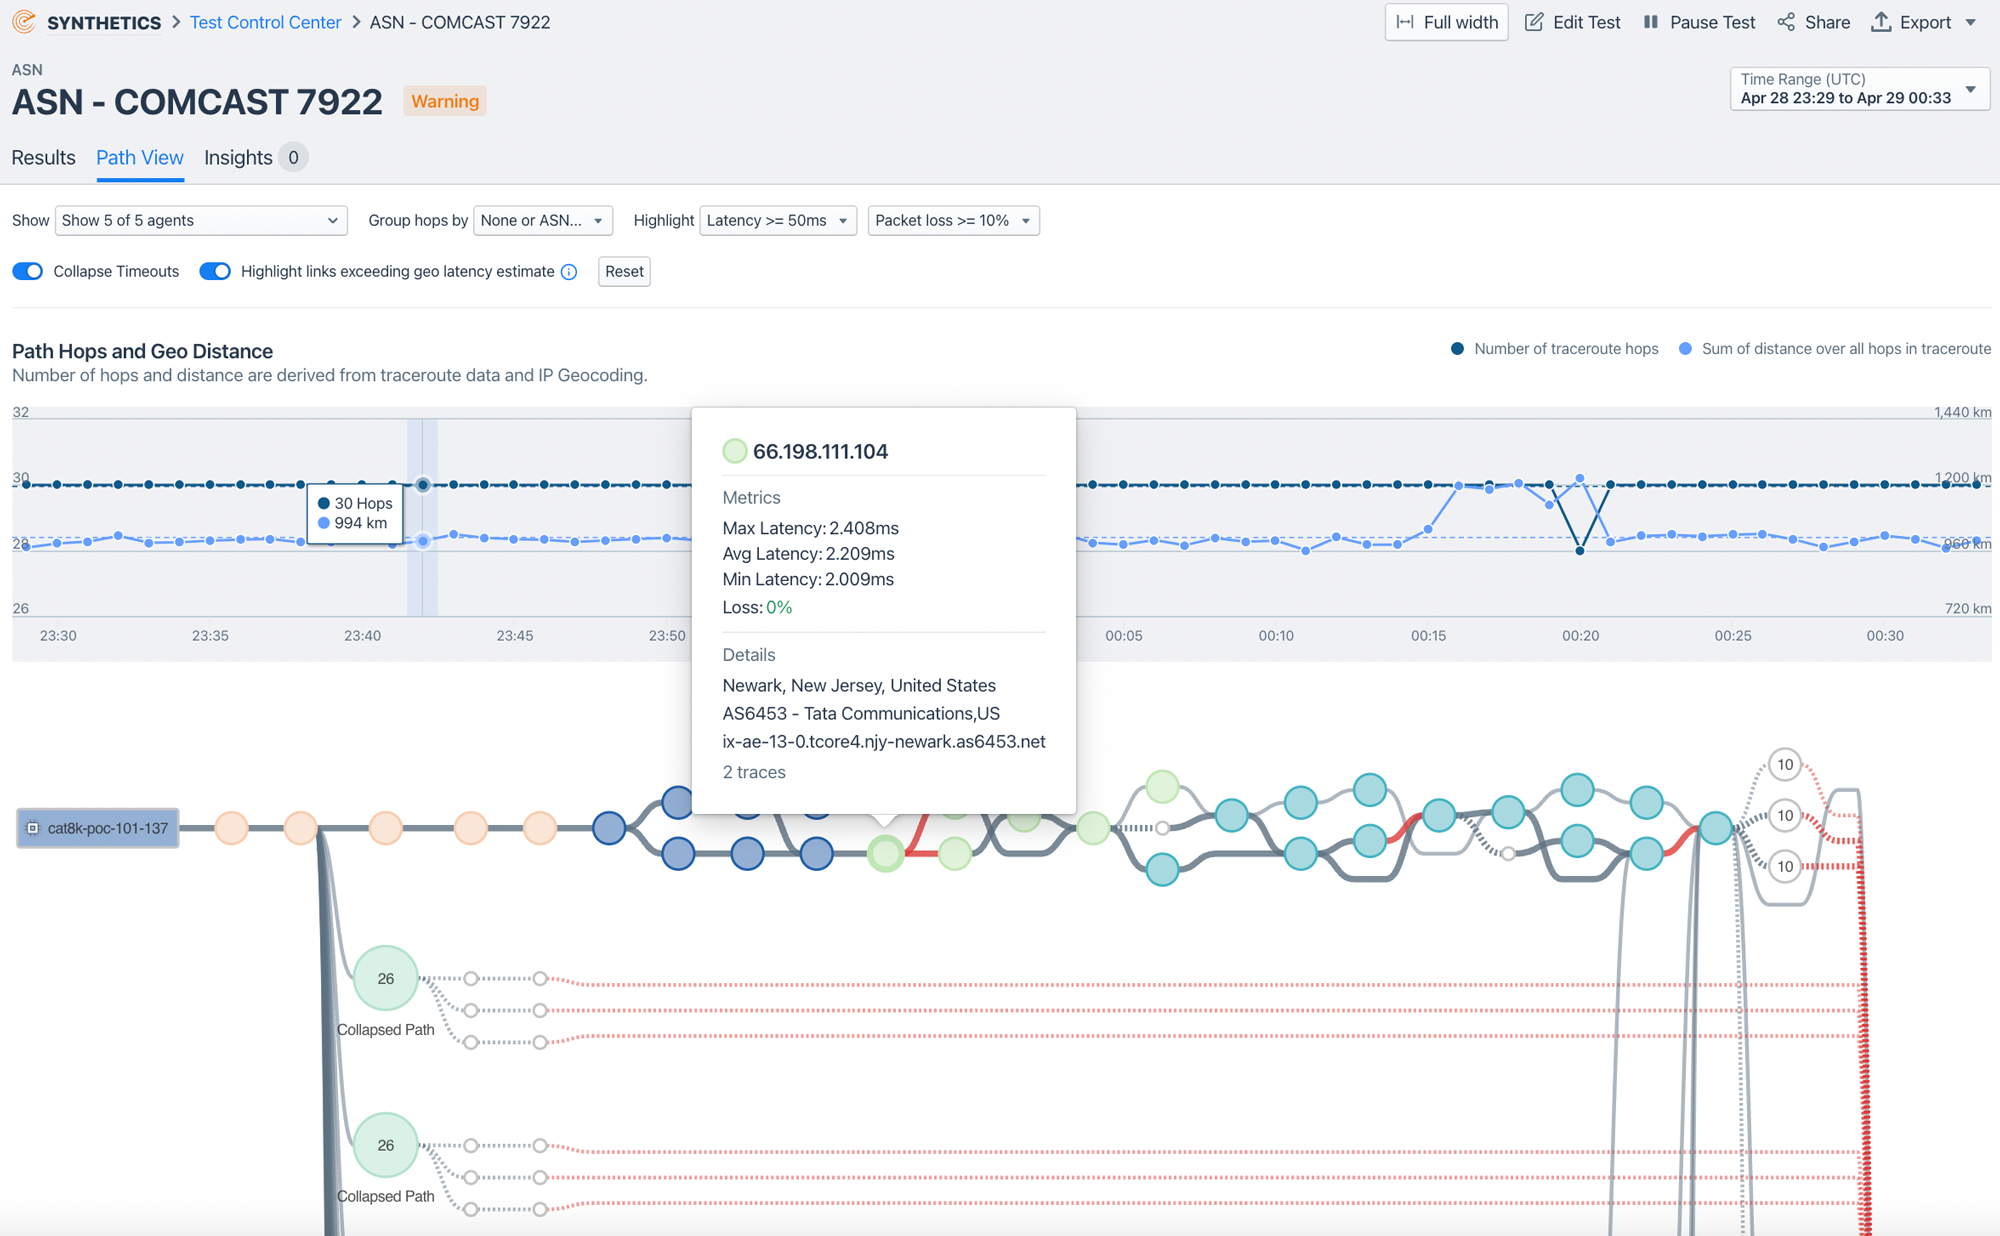
Additionally, synthetic tests can be used to analyze and alert on application network health and performance metrics such as ping latency, jitter, packet loss, HTTP latency, and certificate expiry. Solutions like Kentik also allow automatically running traceroute tests to understand metrics such as the maximum number of hops between various network destinations.
Page Load Testing
Page load speed is an essential component of user experience in web applications. Synthetic tests can be used to automatically and periodically test load times for various web application pages. These tests can provide a granular breakdown of how every component on the page is loading. Using that information, web app developers can easily track down precisely what’s impacting a site’s performance—whether it’s a site hosted on-premises, in the cloud, or by a SaaS provider.
Kentik’s sophisticated page load testing goes beyond basic load time analysis. It involves using Headless Chromium, run by Kentik app agents, to perform a full browser page load test. This approach provides a granular breakdown of the loading process for each component on a page, offering invaluable data for web developers to pinpoint performance bottlenecks.
For a short video overview of how page load testing works, see “Solving Slow Web Applications with the Kentik Synthetics Page Load Test“.
Transaction Monitoring
In addition to testing the basic response/loading behavior of a website, network service, or application, synthetic monitoring can simulate a user’s interactions with a web application. A “transaction” in this context is a series of actions that a user might take (e.g., logging in, searching for some product, adding that product to a shopping cart, and checking out).
After creating a clickpath script or recording a clickpath representing the transaction, remote agents can replay that script (simulating the user requests) to test the performance and availability of the various steps and collect performance data about the transaction.
For example, in Kentik, such tests are a series of actions that are driven by a Google Puppeteer script (created using the Recorder tab in Chrome Developer Tools) that is executed by an agent running Headless Chromium. The results of such tests include the health status and total transaction time for each agent from which tests are being run and can show any screenshots that the script creator specified as actions in the script.
Learn more about this topic in our article, “What is Synthetic Transaction Monitoring?”
API Monitoring
Though it’s just a special case of web application monitoring, it’s worth mentioning that synthetic monitoring can be used to automatically test the availability and proper operation of any REST API (a collection of API endpoints) or an individual API endpoint. As in web performance monitoring, the availability and proper operation of GET, HEAD, PATCH, POST, PUT methods for various API endpoints can be tested. In Kentik Synthetics, ping, traceroute, and BGP (border gateway protocol) data can also be collected.
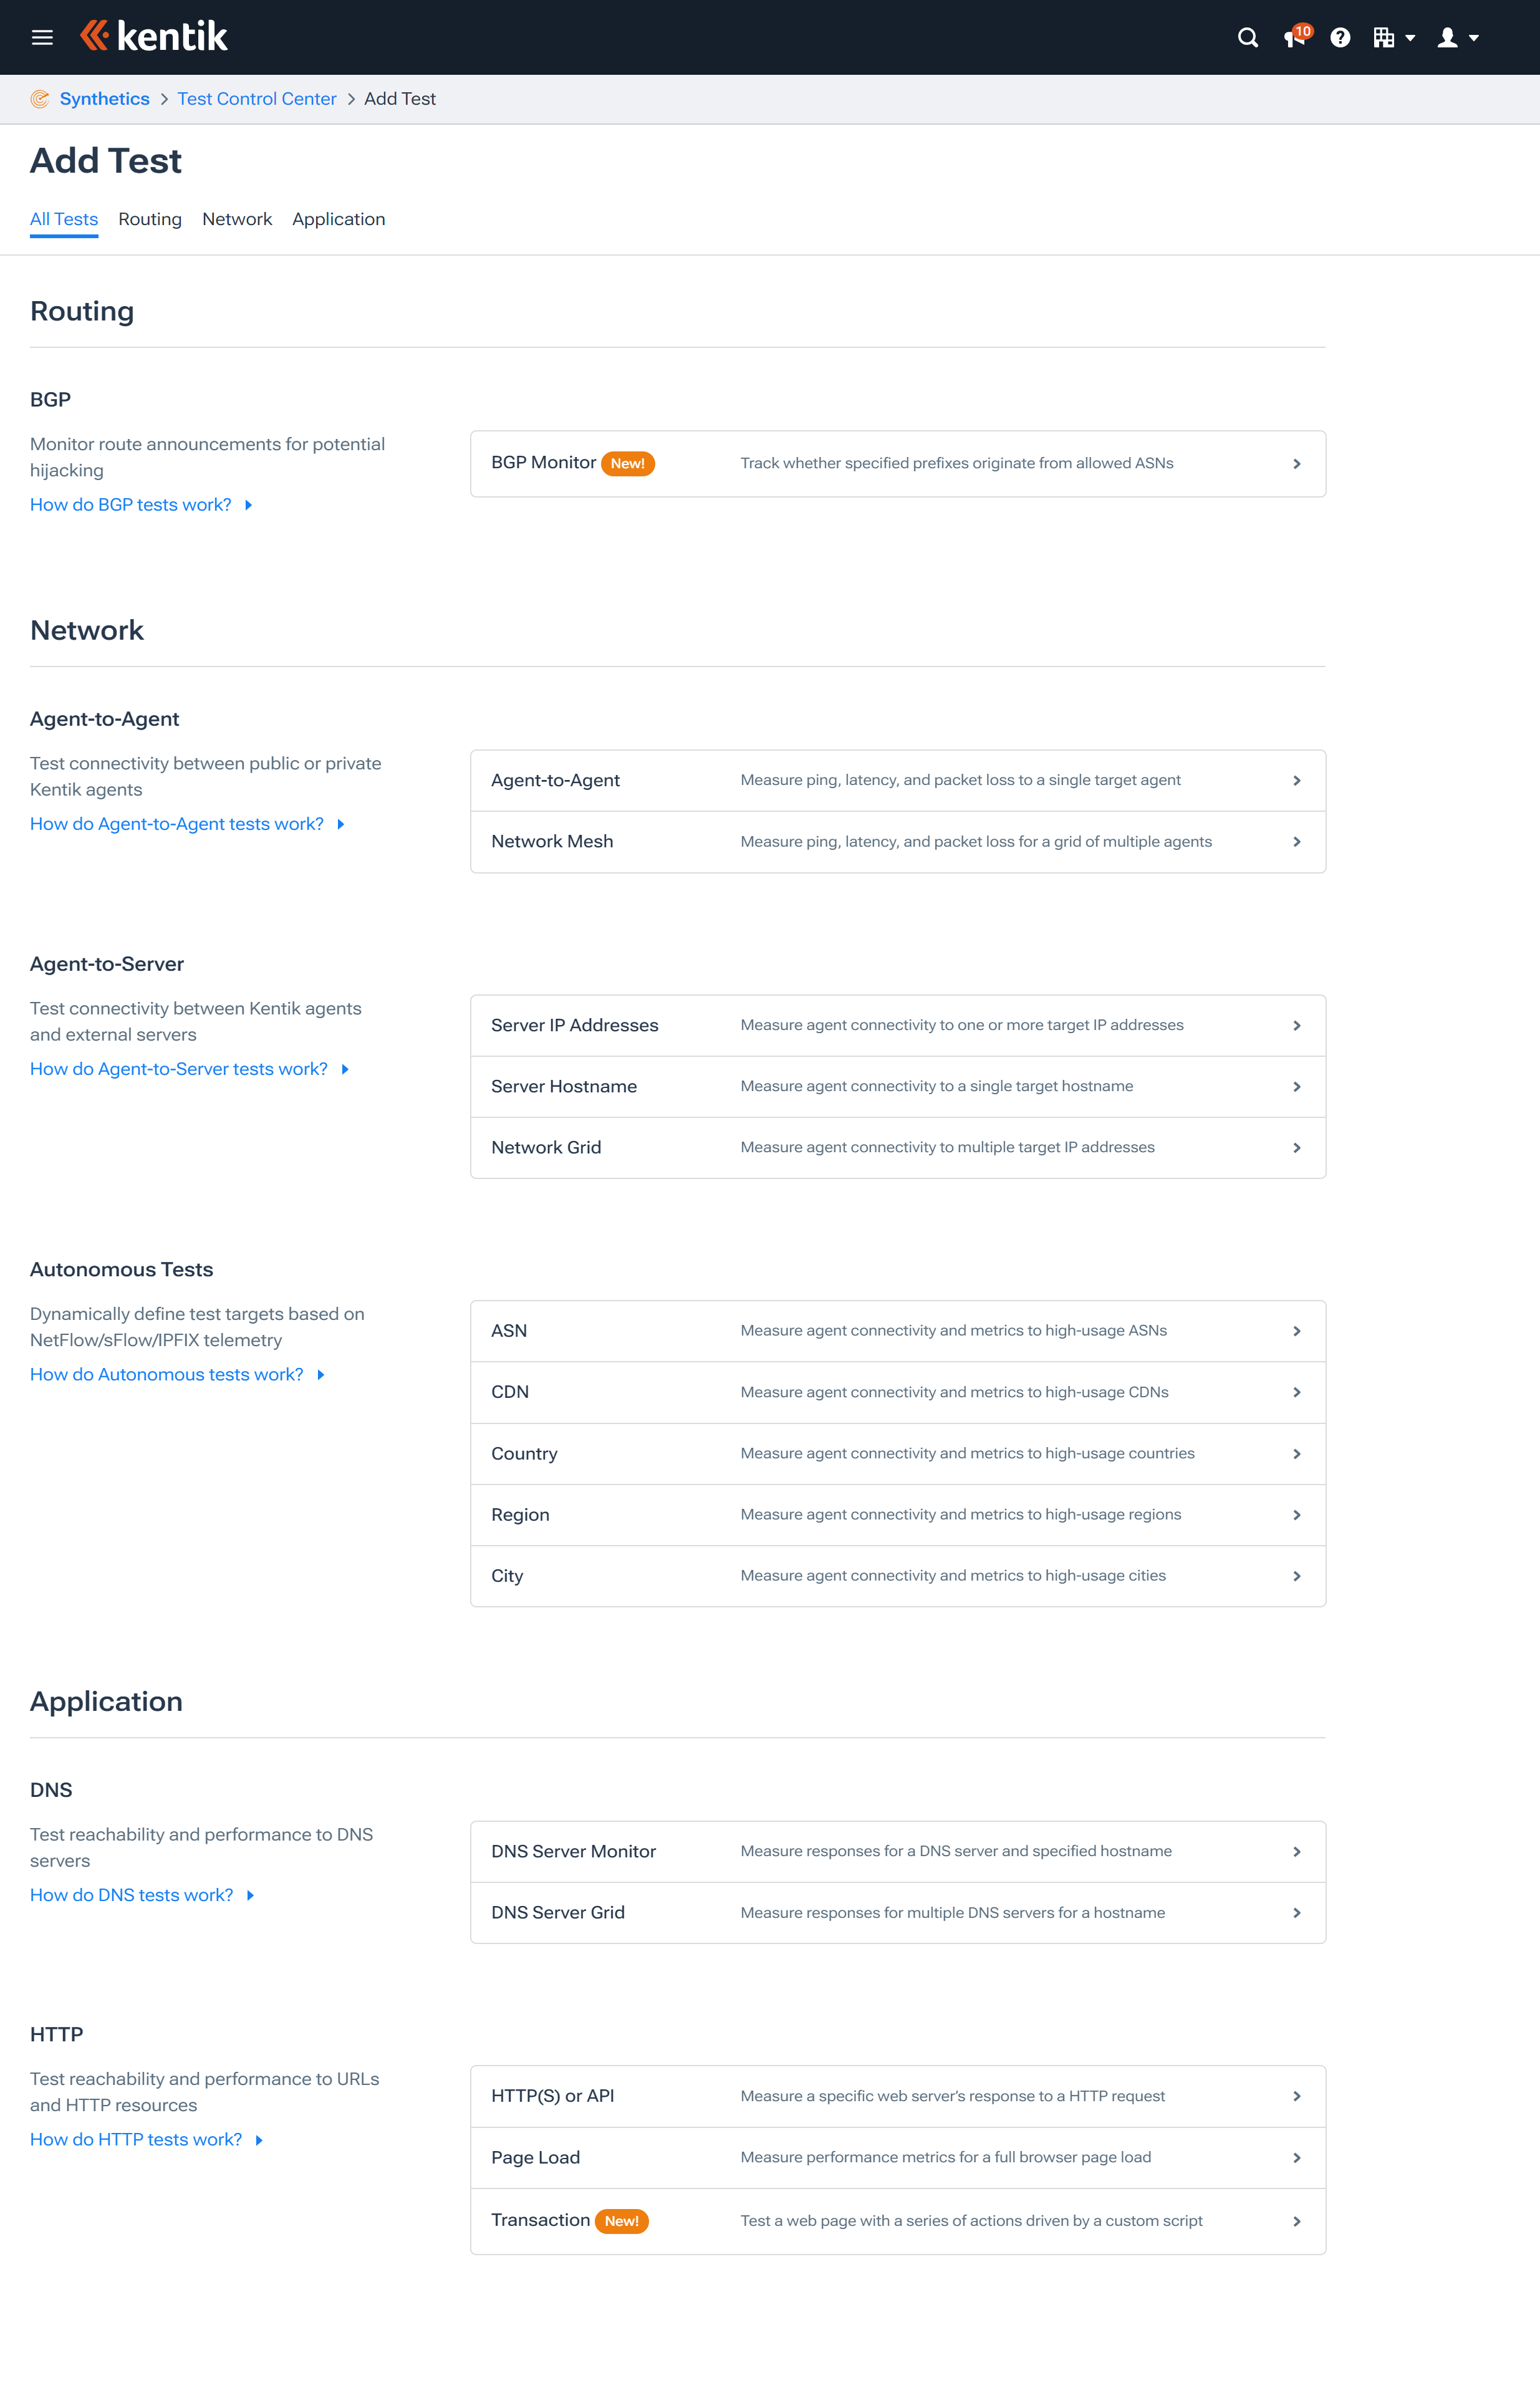
Network and Routing Tests
Synthetic monitoring can also be used to monitor network performance to IP addresses, hostnames, and mission-critical SaaS services or to set up tests between agents themselves.
Enhanced BGP Monitoring
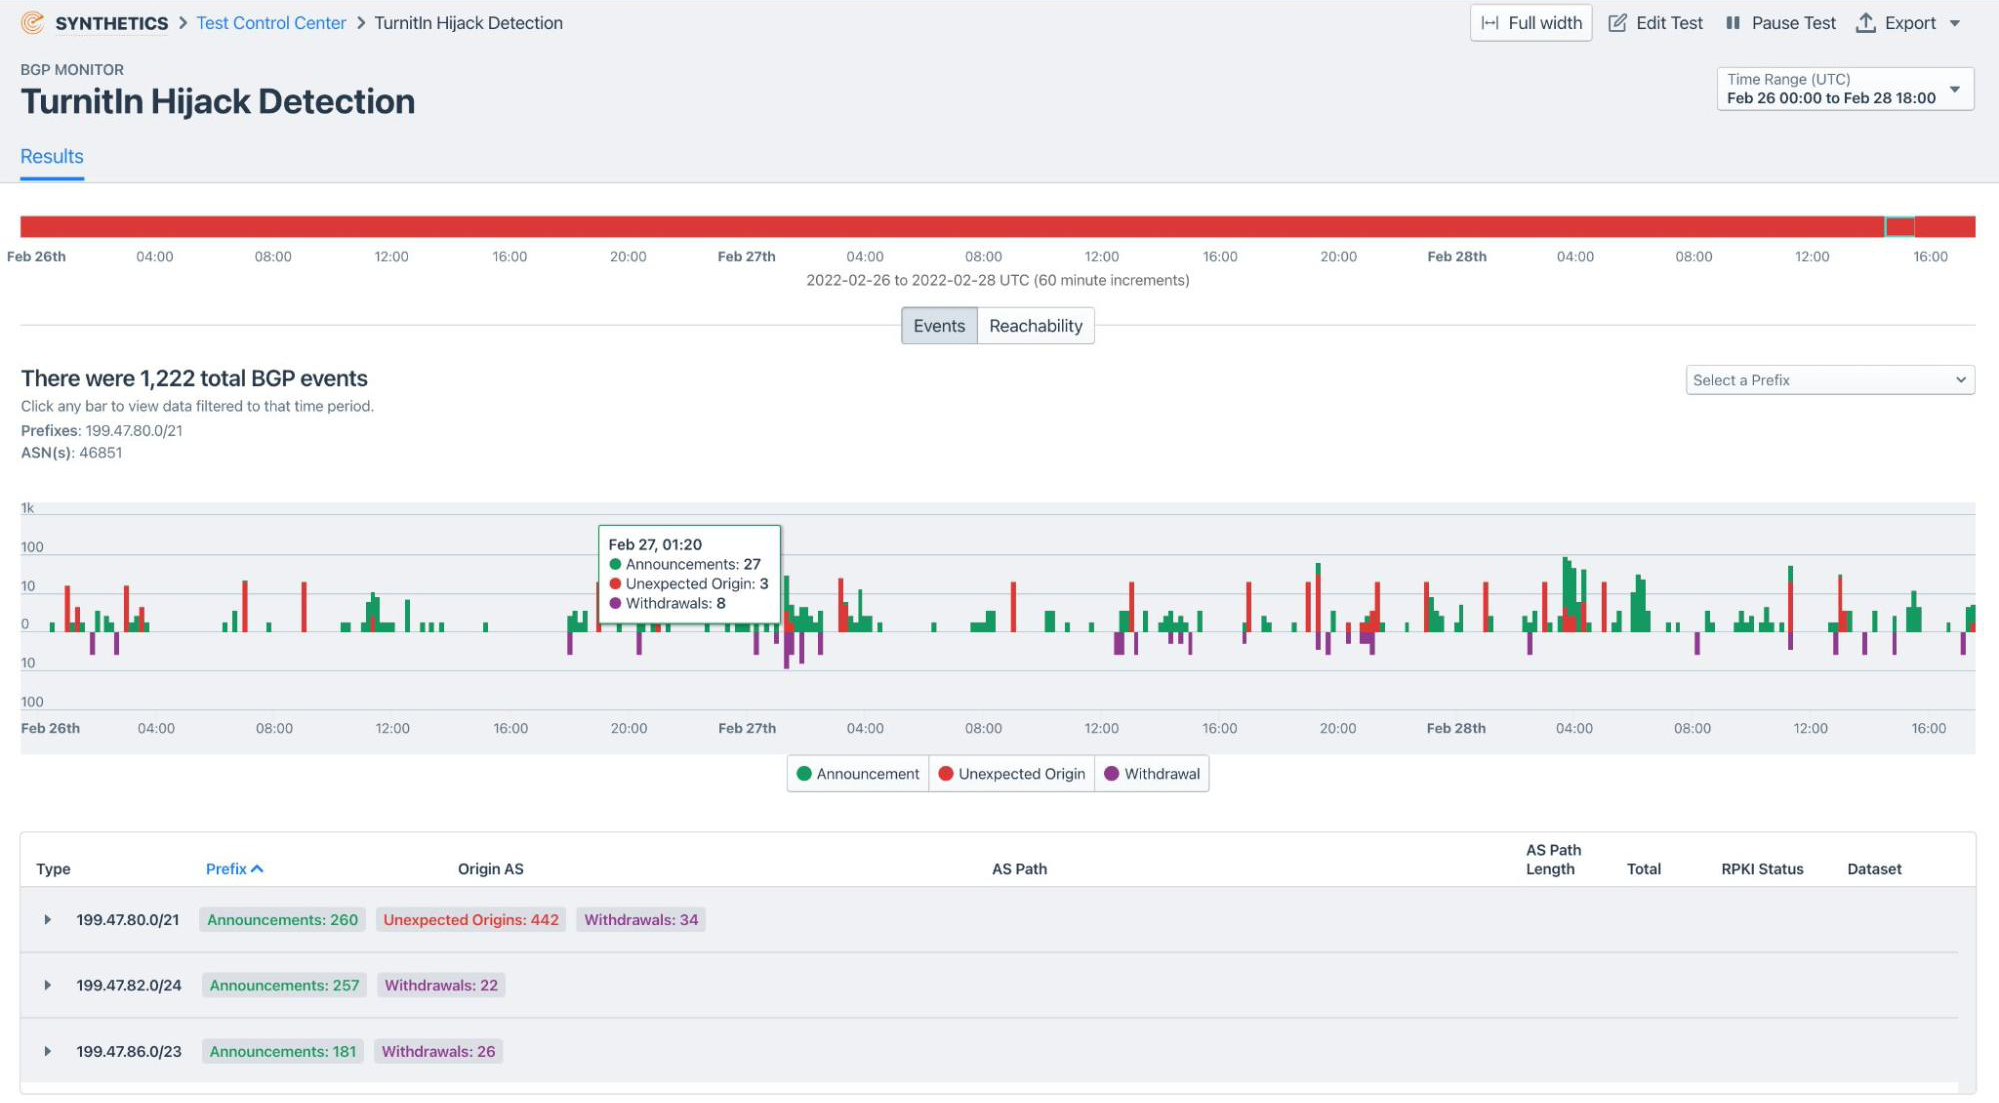
Kentik’s synthetic monitoring tool includes advanced BGP monitoring capabilities, that can provide alerts on route leaks and hijacks. These features are essential for maintaining the integrity and security of data paths across the internet, ensuring reliable and secure connectivity.
Autonomous (Automated) Testing and Test Configuration
Kentik’s synthetic monitoring automates test configurations using insights from actual network traffic. This allows for “autonomous testing”, whereby the platform intelligently leverages your network’s traffic data (provided by data sources such as NetFlow) to automatically generate tests towards the most frequent network sources and destinations.
By analyzing flow records along with correlated network traffic data (such as SNMP, BGP, GeoIP, etc.), the platform can automatically select IP addresses to test from or toward. Types of tests that can be automatically configured include ASN tests, CDN tests, and tests to and from various geographic locations. This proactive approach ensures that tests are continually refined and relevant to current network conditions, allowing NetOps to focus on critical performance indicators without manual intervention.
DNS Server Monitoring
Synthetic monitoring can also be used to measure the availability and responsiveness of DNS Servers or to verify the DNSSEC keychain. In this application, tests report on the performance of one or more DNS servers associated with a hostname, showing the address resolution time and the resulting IP address provided by those servers.
Real-Time Alerts for Immediate Response
Kentik’s platform offers real-time alerts and insights, enabling network teams to quickly identify and address performance issues as they occur. This capability ensures that potential disruptions are managed proactively, maintaining a seamless user experience.
Synthetic Monitoring Use Cases Across Customer Segments
Kentik’s synthetic monitoring solutions are tailored to meet the diverse needs of various customer segments:
- Network Service Providers: Use synthetic monitoring to test network performance autonomously and uphold SLAs.
- Corporate IT Departments: Employ synthetic tests to monitor public cloud and hybrid cloud connectivity, ensuring a robust digital user experience.
- Digital Businesses: Use synthetic monitoring for comprehensive SaaS app tests, API monitoring, and transaction monitoring to optimize user experience and application performance.
Geographic Distribution of Synthetic Tests
Connections to online resources might originate from anywhere in the world. This means we can’t monitor a cloud-hosted resource for availability and responsiveness from just a single location. Synthetic tests typically measure from multiple, geographically diverse locations, using testing agents located in different data centers worldwide.
For example, Kentik has built out a global network of synthetic testing agents that customers use to verify performance levels of all major public or private cloud-based applications and SaaS applications. These agents are located inside Amazon Web Services, Google Cloud Platform, Microsoft Azure, Alibaba Cloud, and IBM Cloud. Customers can also easily install custom agents in their geographically diverse data centers. This global network of testing agents ensures that businesses can monitor their network performance from multiple points around the world.

With numerous network and infrastructure elements that need to be tested and a user population that is geographically dispersed, the number of testing combinations and permutations can grow to be very large. As a result, the configuration of synthetic tests can become complex and time-consuming when, for example, you want to test between multiple cloud regions (such as AWS regions). See also: “Using Synthetics for Your Cloud Monitoring Needs” and “A Guide to Cloud Monitoring Through Synthetic Testing”.
To manage this complex environment, vendors have developed tools that make implementing and monitoring synthetic tests possible on a large scale. In the following video, Kentik Synthetics expert, Anil Murty, demonstrates the easy configuration of a synthetic testing “mesh” between a variety of cloud services:
This video is a brief excerpt from “How to Continuously Monitor Inter- and Intra-Cloud Performance”—you can watch the entire presentation here.
Why Synthetic Monitoring is Important
Reputation and service level agreement validation are two big reasons why staying ahead of performance issues is a must. It’s straightforward—poor connections can lead to unhappy customers and declining revenue. The sooner NetOps can detect an availability issue, the faster they can react.
Many users today see excessive application latency as a form of outage. Understanding and monitoring when a critical service drops below a minimum level of performance is paramount. A global network of agents that allows for omnidirectional synthetic transaction monitoring is one of the best ways to ensure that all users, regardless of physical location, are experiencing an acceptable level of service.
Some of the most prominent benefits of synthetic monitoring include:
Performance Validation
Using synthetic monitoring, organizations can continuously validate the performance of network, web, and application components, track changes over time, and be alerted to anomalies or problems before they impact the experience of actual end-users.
Establish Baseline Benchmarks
Continually testing various components of a network or application can establish a baseline for expected behavior under normal conditions. Having set baseline metrics, operations personnel can be alerted when the performance of any particular component drops below an acceptable threshold.
User-specific Testing
Synthetic monitoring can be used to perform tests from the perspective of specific users by their role (e.g., a logged-in user, a logged-out user, an admin user, etc.) or by geographic location, helping to ensure system performance in a global sense (both literally and metaphorically).
Industry-Specific Use Cases and Benefits of Synthetic Monitoring
Kentik’s synthetic monitoring tools offer tailored benefits across various industries and customer segments, addressing unique challenges and requirements. By providing detailed insights into network and application performance, these tools are crucial in optimizing user experience, maintaining service quality, and enhancing business outcomes across various sectors. Here’s how different sectors leverage Kentik’s synthetic monitoring:
Network Service Providers
- Autonomous Network Performance Monitoring: Service providers use autonomous ASN tests and CDN testing to assess their network performance, which is crucial for maintaining high service quality.
- SLA Compliance and Monitoring: Service providers must ensure compliance with service level agreements. Synthetic monitoring helps them proactively identify and resolve issues, maintaining customer trust and reliability.
- Cloud and Data Center Connectivity Monitoring: Providers use synthetic monitoring to ensure seamless connectivity between cloud services and data centers, a critical factor in delivering uninterrupted services.
Corporate IT
- Hybrid Infrastructure Performance: For corporate IT sectors, including finance, insurance, and retail, maintaining performance across hybrid infrastructures is paramount. Kentik’s synthetic monitoring allows them to assess performance from internal servers to cloud-based resources.
- Internal Application Monitoring: Monitoring the performance of internally developed applications ensures high productivity and user experience for employees. Kentik’s tools provide insights into app performance, helping in timely optimizations.
Digital Businesses
- Enhancing Digital User Experience: For sectors like eCommerce, SaaS, and FinTech, synthetic monitoring ensures high-quality customer experiences. This includes testing critical business transactions like purchase processes and user interactions.
- Monitoring SaaS Applications: Digital businesses rely heavily on SaaS applications, making it essential to continuously monitor these applications for availability and performance.
Specialized Use Cases
- Network Connectivity Troubleshooting: Identifying and resolving connectivity issues quickly is vital for businesses with complex network infrastructures. Synthetic monitoring offers visibility into network performance, helping pinpoint problems efficiently.
- Monitoring Public Cloud and Hybrid Cloud Connectivity: As more businesses migrate to the cloud, monitoring the performance of these environments becomes crucial. Kentik’s synthetic monitoring provides insights into cloud and hybrid cloud performance, ensuring optimal operation.
Competitive Advantages
- Comprehensive Testing: Kentik’s synthetic monitoring tools offer a range of tests, from page load and transaction monitoring to more complex network mesh and agent-to-agent tests, accommodating the needs of diverse industries.
- Cost-Effective and Scalable Solutions: With its competitive pricing and scalable solutions, Kentik stands out, especially for industries where budget constraints are a significant consideration.
Proactive Performance Management
- Reducing Mean Time to Resolution (MTTR): By identifying and proactively addressing network and application issues, Kentik’s synthetic monitoring tools help reduce the time taken to resolve issues, enhancing overall operational efficiency.
- Holding Third-Party Providers Accountable: For industries reliant on third-party services, synthetic monitoring ensures these providers meet agreed-upon standards and SLAs.
Cost Considerations in Synthetic Monitoring Tools
Synthetic monitoring can be costly due to several reasons:
-
Scale and Frequency of Testing: The more extensive your infrastructure and the more often you run tests, the higher the cost. Synthetic monitoring involves running simulated user interactions continuously or at regular intervals. The costs can quickly increase if you have numerous web pages, applications, or services and need frequent monitoring.
-
Location of Monitoring Agents: Monitoring performance from different geographic locations is essential for businesses with a global user base. This usually involves deploying monitoring agents in various regions, which can increase costs.
-
Complexity of Simulations: Simulated user interactions can range from simple to complex, with the latter requiring more resources. For example, transactional tests that mimic a multi-step process, like completing a purchase on an e-commerce site, are more complex than a simple ping test to check if a site is available.
-
Data Storage and Analysis: All the data generated by synthetic monitoring needs to be stored, processed, and analyzed. The volume of data can be considerable, especially for large-scale, frequent tests. Depending on the service provider, costs may increase with the amount of data generated.
-
Tools and Licenses: Some synthetic monitoring tools or platforms charge based on the number of tests or scripts, the number of applications monitored, or the number of users. Costs may also rise with the sophistication of the tool, such as AI-driven analysis or advanced alerting capabilities.
-
Maintenance and Staff Training: Maintenance costs of the tools, as well as staff training to interpret the results, can also contribute to the overall cost.
Hence, businesses need to balance the cost and their monitoring needs. This is where flexible, scalable solutions like those offered by Kentik can come in handy, providing a predictable pricing structure while allowing comprehensive synthetic monitoring. Kentik’s approach to pricing synthetic monitoring helps mitigate these potential cost hurdles in several ways:
-
Predictable and Scalable Pricing: Kentik offers simple pricing that allows network teams to run more tests at a lower cost than competing tools. This helps to control the costs related to the scale and frequency of testing.
-
Automated Cost Management: The Kentik management console automatically calculates the number of credits needed per test and alerts you ahead of time if you may be running out of credits. This feature aids in preventing unexpected costs and helps manage resources efficiently.
-
Flexible Plans: Kentik Pro and Premier customers receive a substantial number of monthly credits, enabling regular and extensive testing without worrying about additional costs. Should there be a need for more, additional credits are available by purchasing a SyntheticPak.
-
Comprehensive Solution: Kentik’s solution also includes advanced capabilities such as AI-driven analysis, which can provide more insight and value without necessitating additional investment in multiple tools or licenses.
Kentik’s approach to pricing synthetic monitoring is designed to provide transparency, flexibility, and efficiency, thereby helping to manage and reduce the potential costs associated with synthetic monitoring.

About Kentik’s Synthetic Monitoring Solution
The Kentik Network Observability Cloud offers a modern, SaaS-based approach to digital experience monitoring. Kentik’s network monitoring solutions addresses all three pillars of modern network monitoring, delivering visibility into network flow, powerful synthetic testing capabilities, and Kentik NMS, the next-generation network monitoring system.
To see how Kentik can bring the benefits of network observability to your organization, request a demo or sign up for a free trial today.
