Network observability for Azure cloud deployments
The migration of applications from traditional data centers to cloud infrastructure presents a new set of visibility problems. And it’s tempting to think that “the network” is just one of the many infrastructure management headaches that disappear after migrating to the cloud. However, most organizations find that understanding the network behavior of cloud-deployed applications is still a critical part of ensuring their availability and performance at optimized cost. But pervasive visibility of network traffic details hasn’t been available in the cloud.
See clearly with Kentik
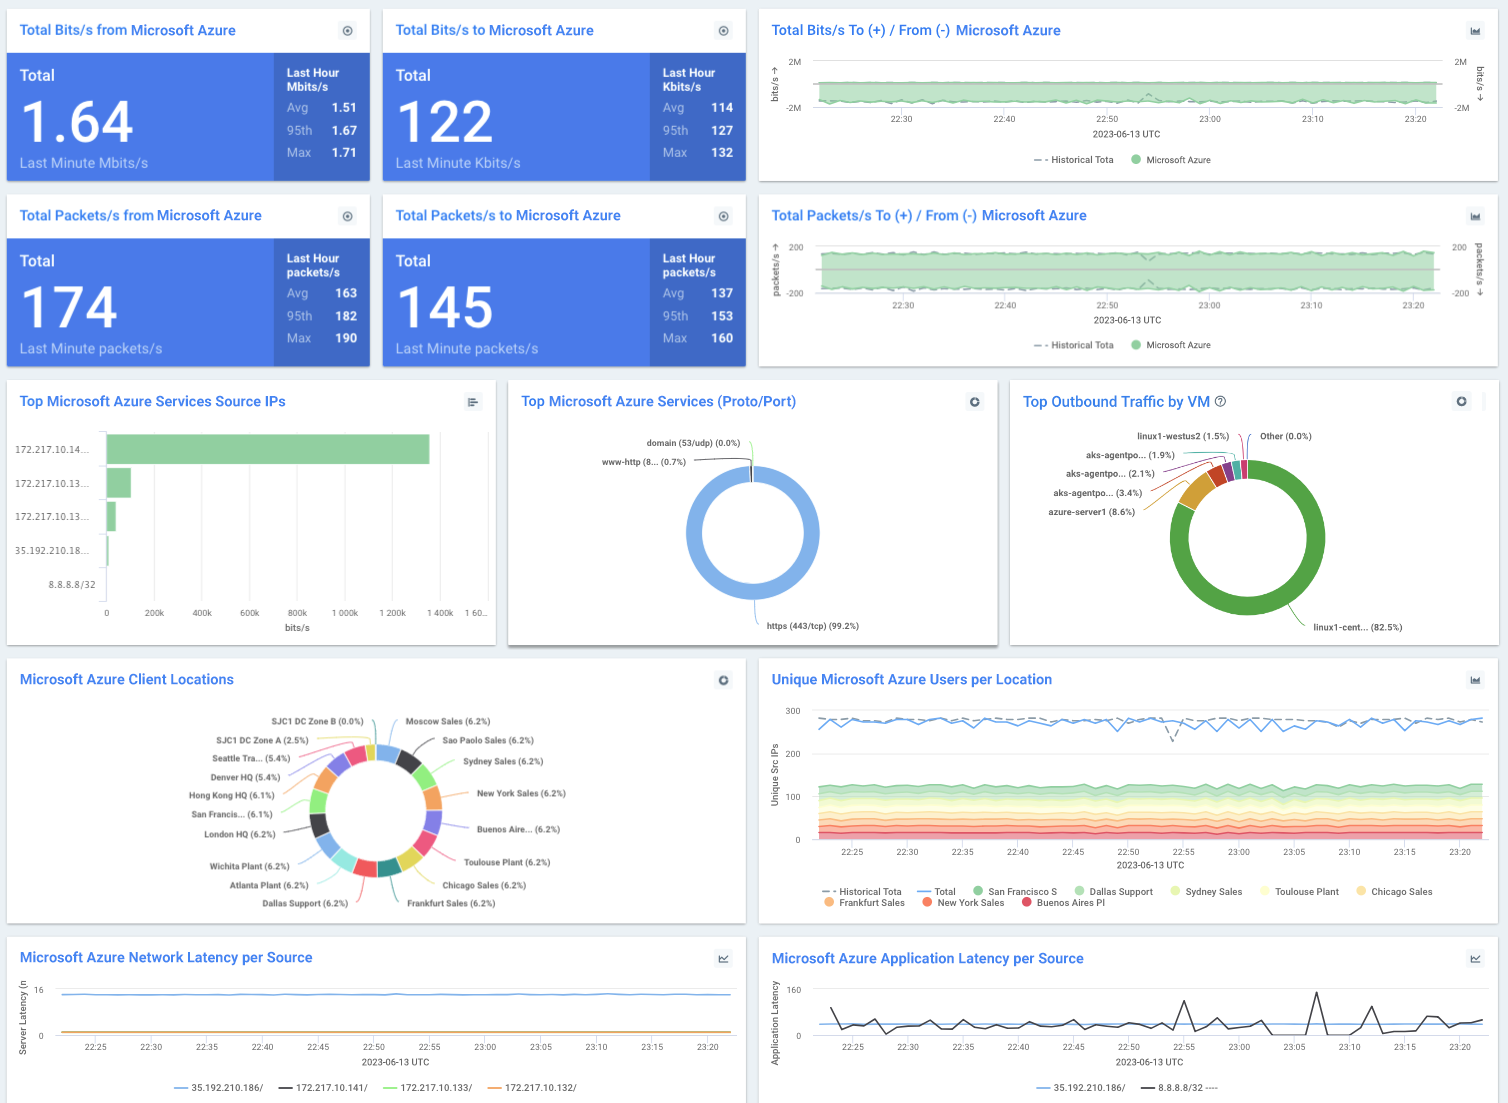
Kentik enriches Network Security Group (NSG) and Azure Firewall Flow Logs with application, business, and security context, analyzing them to deliver insights and comprehensive visualizations, so that cloud ops teams can stop flying blind. NSG and Azure Firewall Flow Logs provide granular details of all ingress and egress IP traffic on a per-rule basis with no need to instrument VMs or services individually. Streamed to Kentik’s observability platform in real-time, flow logs provide powerful insight for teams across the organization. Since Kentik provides traffic and performance data about all networks, from data center to cloud to container and across all major public clouds, it offers engineers a unified view of how NSG and Azure Firewall traffic fits within an organization’s entire hybrid network.
Learn more about Kentik’s Azure observability solutions.
Executives
Executives gain multi-cloud observability built for hybrid infrastructure, which futureproofs teams against rising complexity, and helps decrypt costs to unlock cloud savings. Kentik’s network-level insight keeps investigations from devouring engineering cycles, so teams can do more in less time. Customizable dashboards give executives insight into user/customer experience KPI trends, and visualize the big picture of cloud infrastructure performance and budget. With customizable dashboards and an intuitive UI, executives can use insights from Kentik to see the big picture, understand changes in user/customer experience KPIs, effectively control infrastructure cost, and better strategize hybrid/multi-cloud deployment/migrations based on spending, budgets, and expectations.

NetOps and NetEng teams
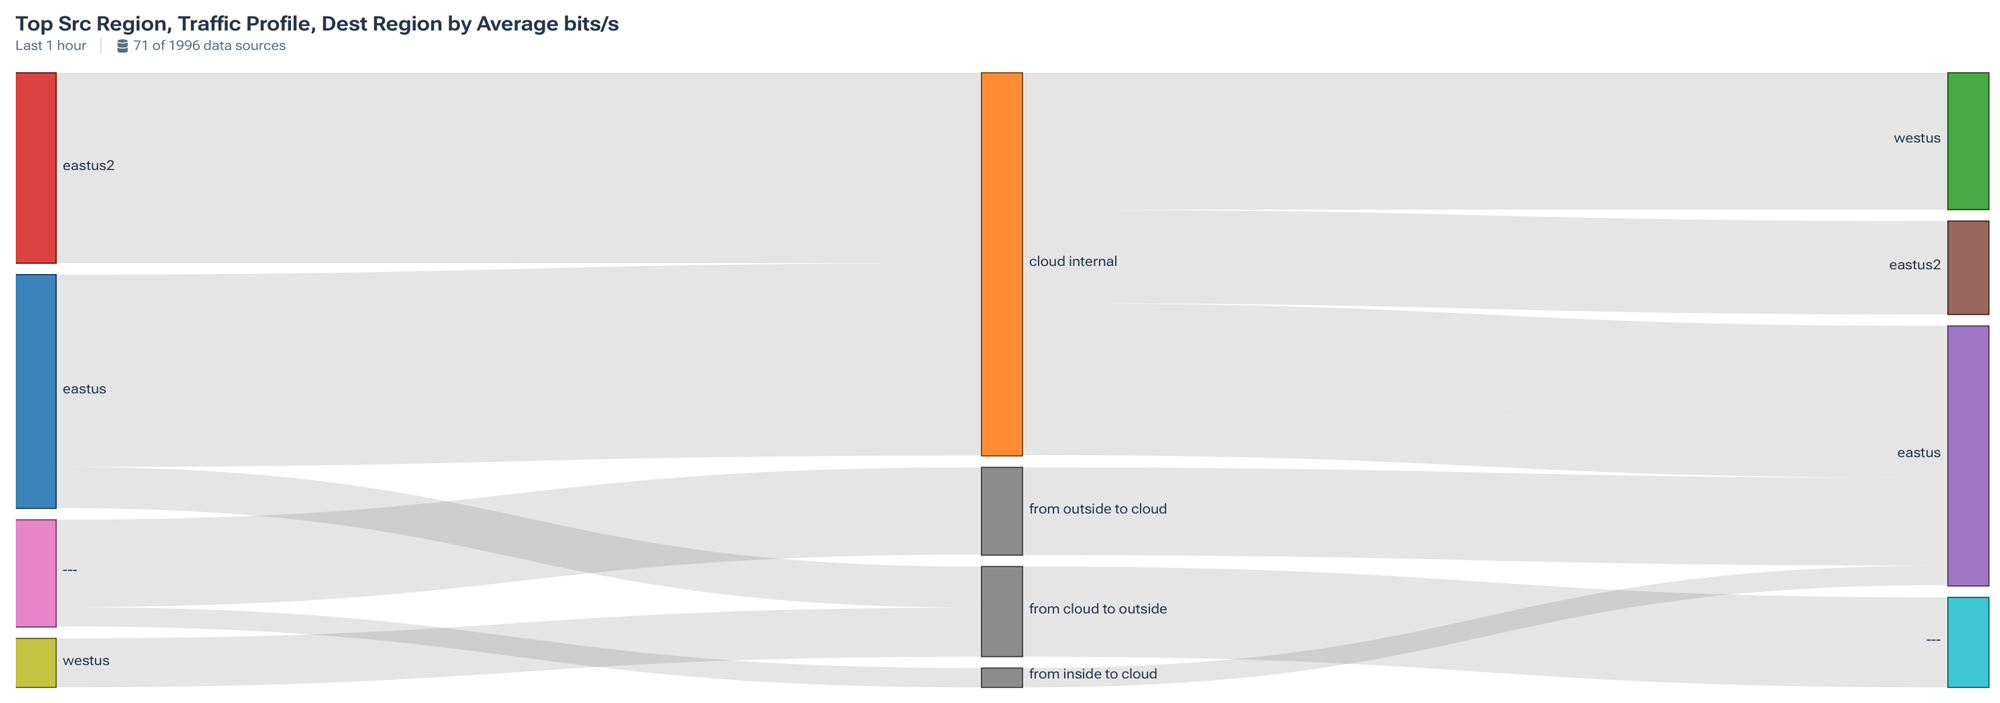
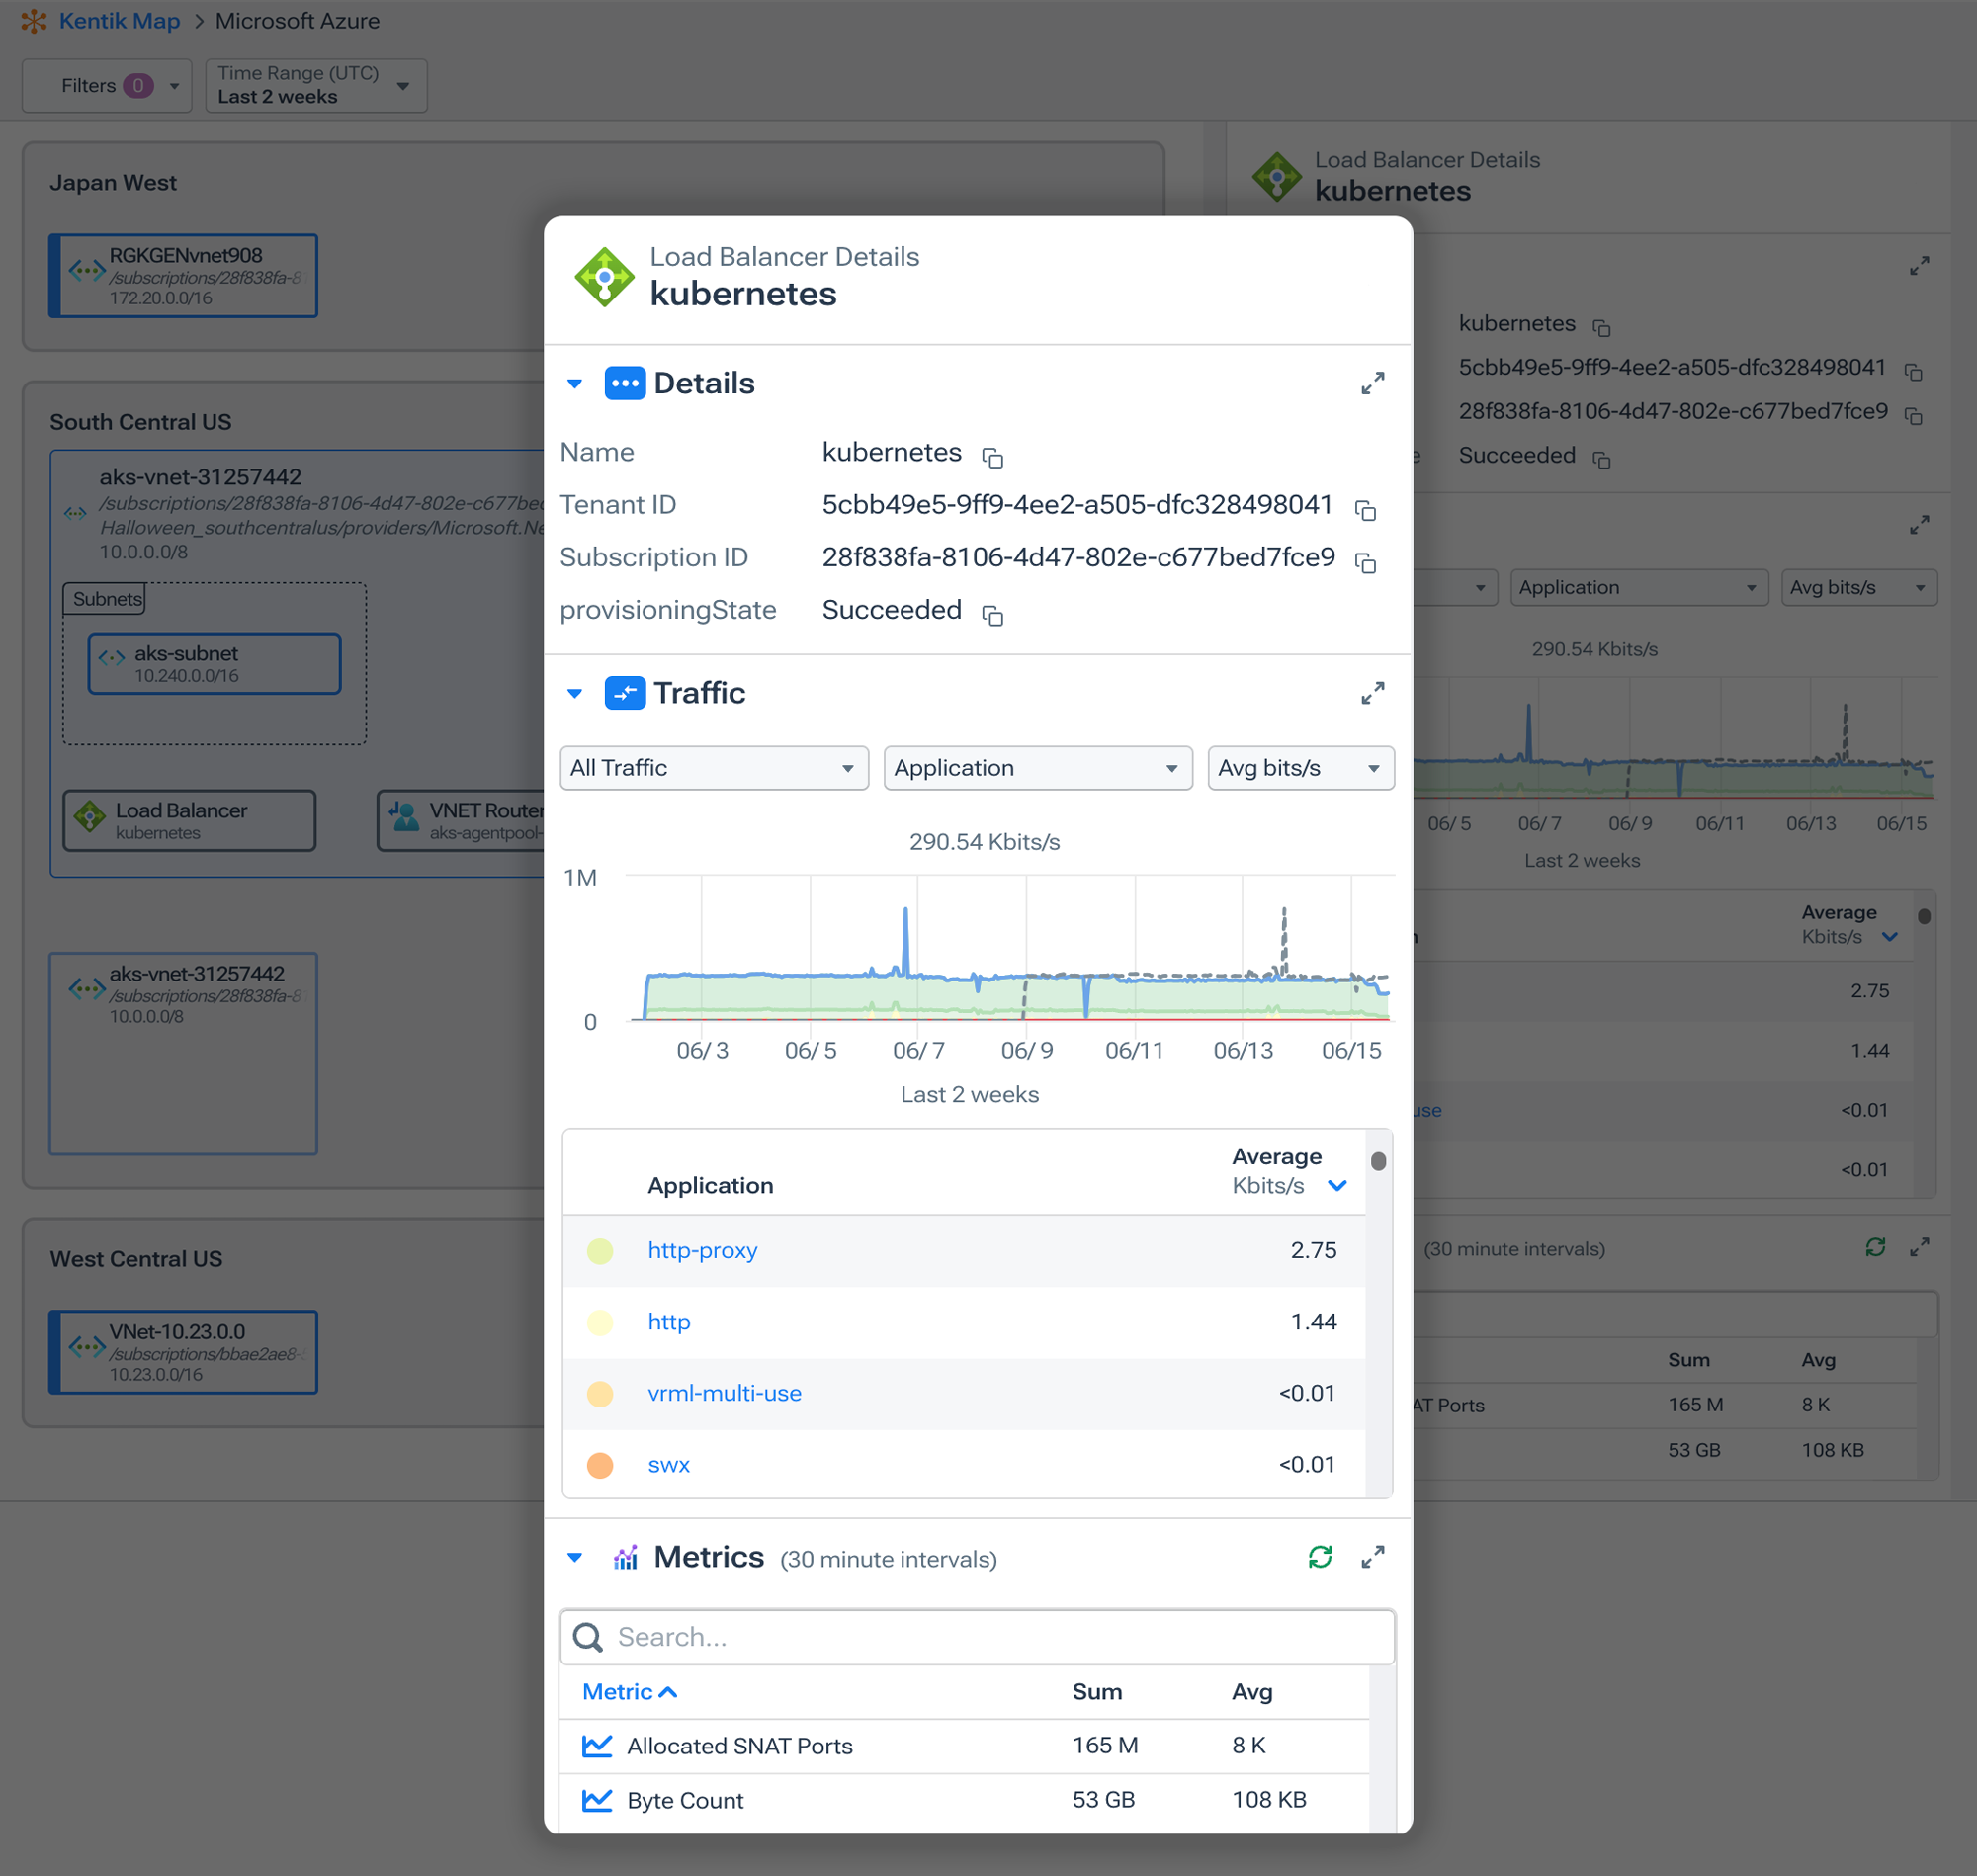
Network operators and engineers gain the ability to visualize traffic flows between regions, understand service dependencies and identify connectivity issues within the cloud environment or between cloud and on-premise infrastructure, and utilize a data-driven approach to cloud infrastructure planning, growth, and cost management.

DevOps and SRE teams
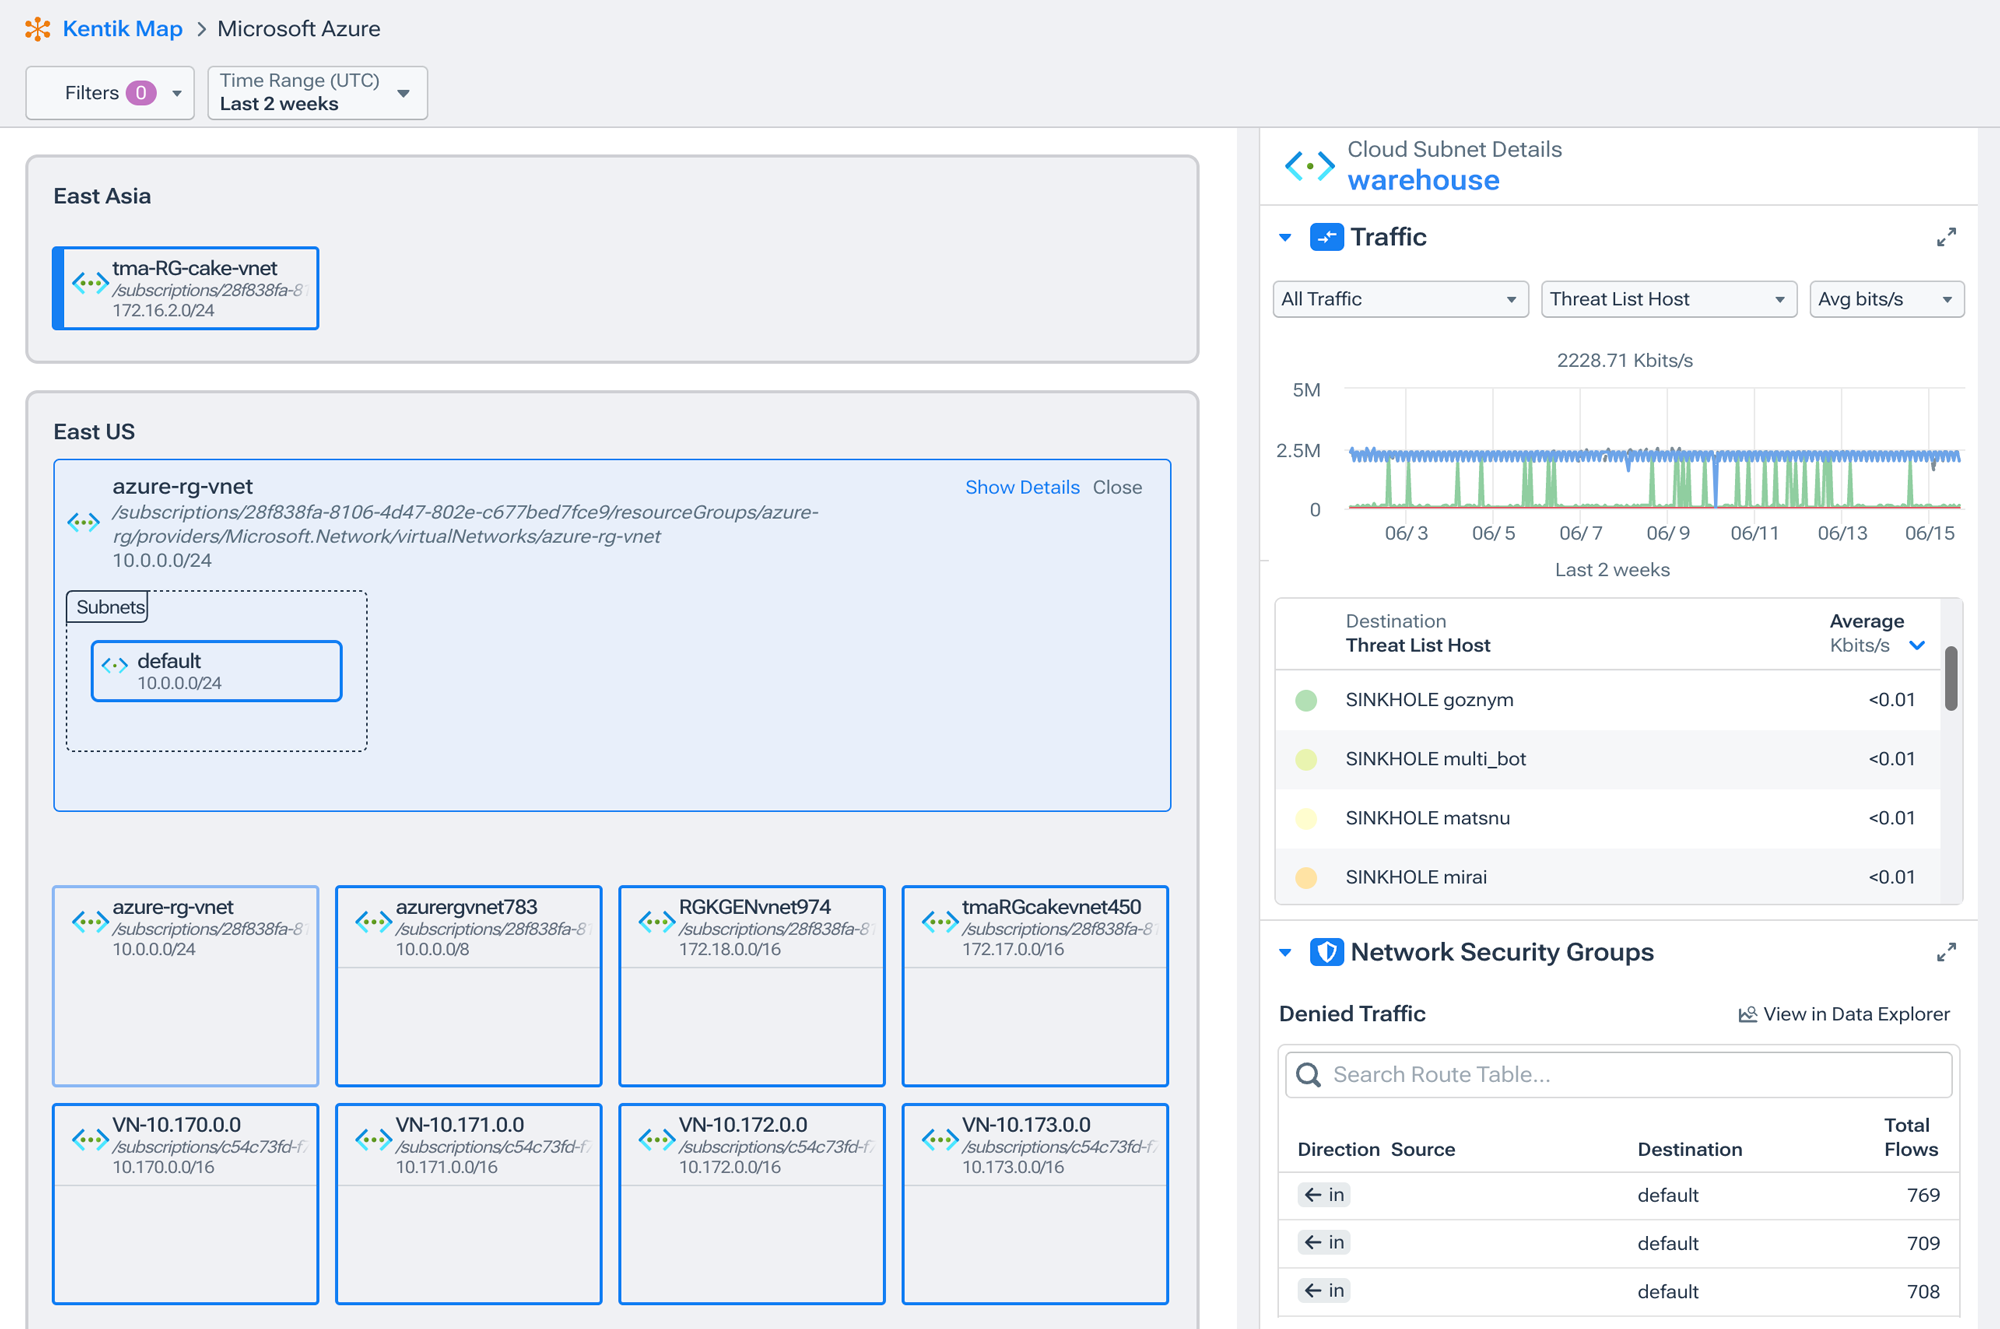
Fast filtering, pivots, and drill-downs provide instant situational awareness, so DevOps and SRE (site reliability engineering) teams can quickly get to root cause and gather the details they need to restore services to a healthy state. Kentik highlights inter-service communications and connectivity issues without the need to dig into code. Refining cloud network policies becomes much more efficient with quick insight into denied traffic and how it relates to access control list and security group configuration.

SecOps teams
Security engineering and operations teams gain pervasive instrumentation of potential threat activity to, from, and within Azure environments for faster incident response and more granular forensic analysis.
