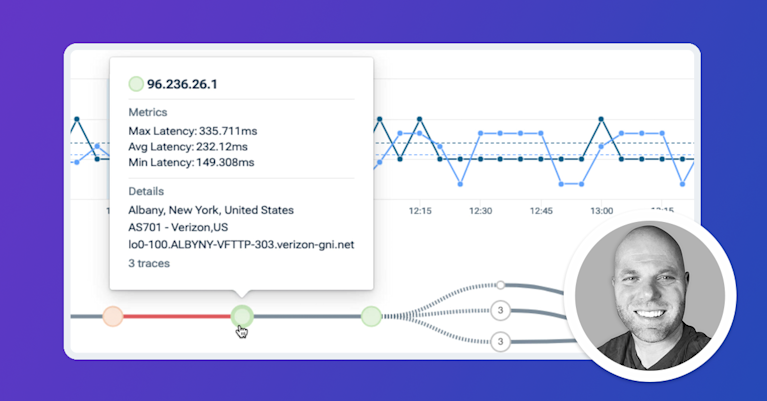
Troubleshoot Any Network — Faster Than Ever
Resolve issues 400% faster with lightning-fast querying and instant answers.
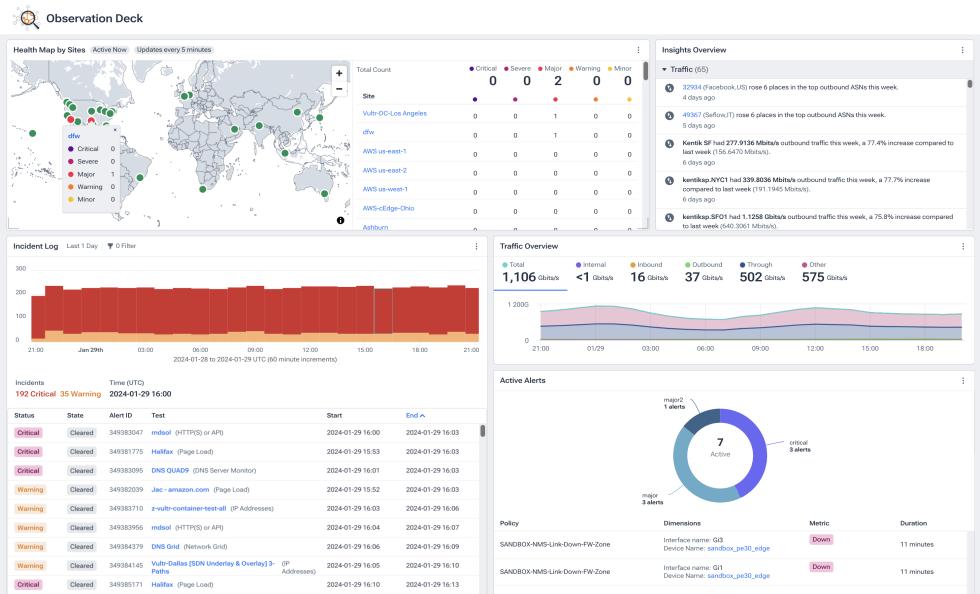
Data centers, WAN/SD-WANs, hybrid and multi-clouds, SaaS, internet, and campuses.
Automatically detect anomalies, attacks, customer experience challenges, and more.
Hundreds of dimensions. Highly granular filtering. Harness the power of your data with unbound exploration.
Identify root cause in record time
- Ask questions interactively and evaluate problems from multiple angles to uncover affected applications, services, and users.
- Quickly hone in on problems, eliminate complexity and noise, and know immediately when it’s not the network.
- Drill to any level of detail with our infinitely granular data store.
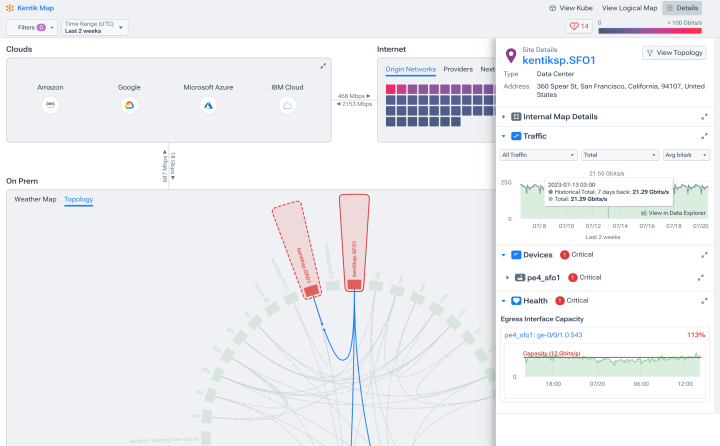
Minimize business impact of network problems
- Integrate network data into incident management and SIEM tools to improve service quality and enhance security policies.
- Avoid network downtime and detect network performance issues before they critically impact end users.

Query data at lightning speed
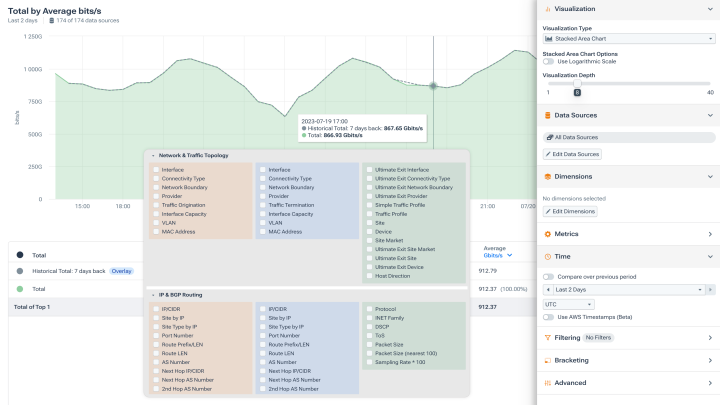
- Query, filter, pivot, drill in, zoom out, and add context by selecting predefined and custom dimensions from a menu – no need for complex query statements.
- Query mountains of data in seconds – average query response time across all Kentik users is less than one second.
Proactively spot (and resolve) brewing issues
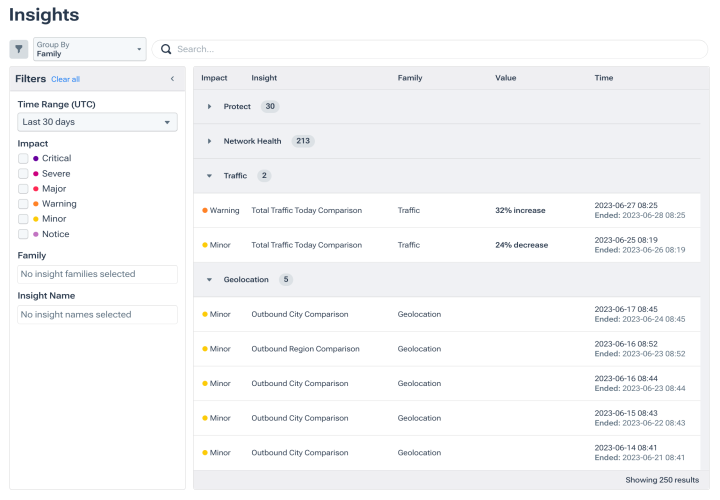
- Start with a question or be proactively alerted to brewing issues with AI-driven insights.
- See anomalies, unexpected spikes, or potentially malicious traffic early so you can take action before things get out of hand – maybe before anyone even knows.
- Investigate efficiently with nearly limitless data and network exploration capabilities.
Save time with integrations and automation
- Up your efficiency level with built-in workflows for network operations, reporting, capacity planning, and traffic engineering.
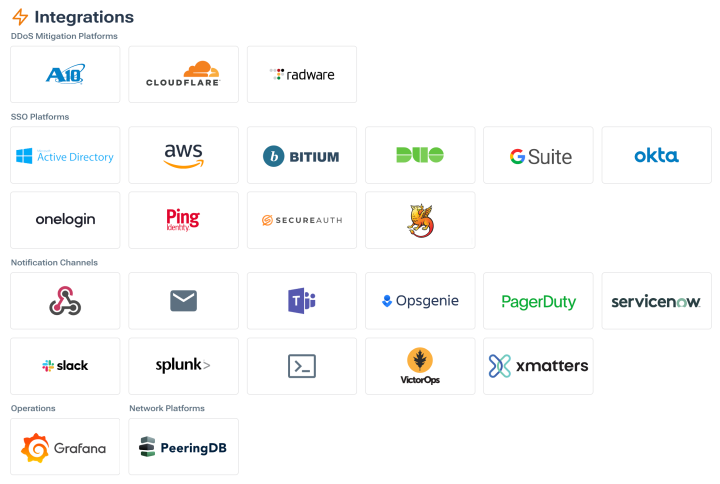
- Leverage ticketing system integrations and APIs to automate workflows, generate real-time alerting, and initiate faster response time.
- Bring teams together by sharing enriched network telemetry with analytics tools and data lakes using Kentik Firehose.

“Kentik helps us diagnose network-related problems much faster. The ability to dive in and put a trace on every connection is a huge benefit.”
Explore the platform
Network Troubleshooting FAQs
How can I reduce mean time to detect and mean time to resolve network incidents?
Reduce MTTD/MTTR by combining proactive detection (alerts, insights, synthetics) with fast investigation across correlated telemetry. Kentik accelerates this by enabling rapid pivots in Data Explorer, surfacing meaningful Insights, and using AI Advisor for guided triage and repeatable workflows that move teams from symptom to root cause faster.
What tools enable rapid RCA for multi-cloud application outages?
Use tools that combine multi-cloud traffic visibility, topology mapping, and proactive path testing. Kentik provides an interactive map of hybrid/multi-cloud connectivity, fast querying in Data Explorer across cloud flow logs and metadata, synthetic testing for path validation, and AI-assisted troubleshooting with AI Advisor.
How do I unify network, cloud, and app telemetry for troubleshooting?
Unify telemetry by correlating network traffic and path evidence with cloud flow logs and synthetic tests, then sharing the same time windows and dimensions (site, region, service, dependency) across NetOps and app teams. Kentik supports this by unifying hybrid and multi-cloud context with fast traffic and performance analysis so you can quickly prove whether the network is the cause, a contributor, or a bystander and hand off clean evidence to app owners and APM teams. See also: Multi-Cloud Observability.
What’s the best way to detect and diagnose blackholing issues?
Detect blackholing by monitoring sudden reachability loss and traffic drops for affected prefixes and services, then validating from multiple external vantage points whether connectivity fails consistently and where the failure begins. Kentik supports this by combining routing visibility and reachability context with investigation workflows so teams can confirm scope, identify the failing segment or provider, and verify recovery after routing fixes. See also: BGP Route Monitoring.
What’s the best way to troubleshoot routing loops using telemetry?
Troubleshoot routing loops by correlating sudden latency spikes, retransmits, and throughput drops with routing-path instability, then validating whether routing changes are oscillating and which prefixes and paths are involved. Kentik supports this by correlating routing visibility and traffic/performance evidence so teams can confirm when routing behavior is driving repeated detours or instability and validate the fix after policy or peering changes. See also: BGP Routing.

